Working Capital Calculator
Estimate net working capital, current ratio, operating working capital requirement, cash coverage, and balance-sheet mix from current assets and current liabilities.
Calculations use the same currency for every input.
Used for the target ratio and operating-cycle benchmark.
Include unrestricted checking, savings, and sweep cash.
Customer invoices expected to convert to cash within a year.
Raw material, work in process, and finished goods.
Insurance, rent, software, deposits, and other prepaid assets.
Short-term investments, tax receivables, or other current items.
Supplier bills and trade payables due in the near term.
Current notes, revolver use, and current portion of debt.
Payroll, taxes, benefits, and accrued operating obligations.
Deferred revenue, deposits, sales tax payable, or other items.
Used to estimate daily sales coverage and revenue days.
Used for inventory days, payable days, and cash burn coverage.
Minimum days of monthly direct spend held in cash.
Shows the cash released if receivable days improve.
Working capital results
This table shows how each balance-sheet line contributes to total current assets, total current liabilities, and net working capital.
| Component | Classification | Role in formula | Typical review question |
|---|---|---|---|
| Cash and bank balances | Current asset | Add to assets | Is the cash unrestricted and available? |
| Accounts receivable | Current asset | Add to assets and requirement | How much is overdue or disputed? |
| Inventory | Current asset | Add to assets and requirement | How fast does stock turn into sales? |
| Prepaid expenses | Current asset | Add to assets | Can it be consumed within twelve months? |
| Accounts payable | Current liability | Add to liabilities and subtract from requirement | Are supplier terms being used responsibly? |
| Short-term debt | Current liability | Add to liabilities | Does the maturity create refinancing pressure? |
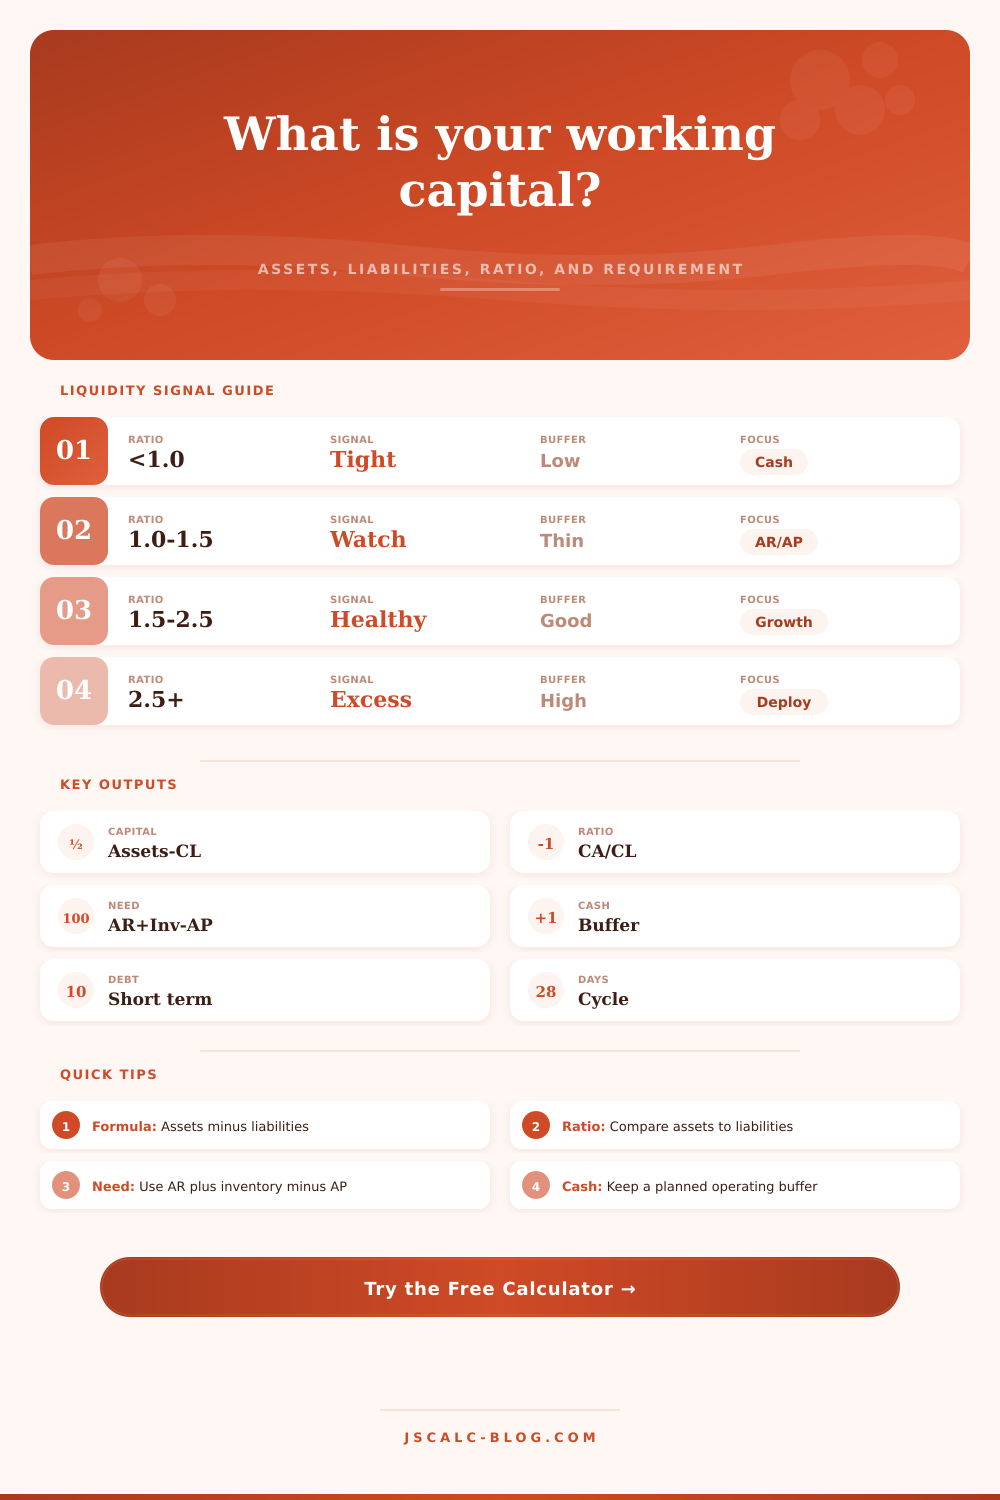
Current ratio is not the whole story, but it is a fast screen for whether current assets cover current obligations.
| Current ratio | Liquidity signal | Working capital meaning | Management focus |
|---|---|---|---|
| Below 1.00x | Tight | Current liabilities exceed current assets. | Prioritize cash, collections, and near-term obligations. |
| 1.00x to 1.49x | Thin | Assets cover liabilities with a narrow cushion. | Watch collections, inventory turns, and debt maturity. |
| 1.50x to 2.50x | Balanced | Coverage is generally workable for many firms. | Keep the operating cycle in line with growth. |
| Above 2.50x | High | Large current asset balance compared with liabilities. | Review idle cash, slow stock, and excess receivables. |
Use the selected profile as a practical comparison point rather than a universal rule. Seasonality, debt terms, and growth stage can move the target.
| Profile | Target ratio | Cycle tendency | Watch item | Common requirement driver |
|---|---|---|---|---|
| Service firm | 1.25x to 1.75x | Receivable-led | Slow invoicing | Accounts receivable |
| Retail or ecommerce | 1.50x to 2.25x | Inventory-led | Seasonal stock | Inventory plus cash buffer |
| Manufacturing | 1.75x to 2.50x | Longer cycle | Raw material build | Inventory and work in process |
| Distribution | 1.40x to 2.10x | Trade-credit cycle | Payable terms | AR, stock, and AP timing |
| Construction | 1.20x to 1.80x | Milestone-led | Retainage timing | AR and accrued costs |
| Healthcare practice | 1.30x to 2.00x | Claims-led | Payer delays | Receivables and payroll accruals |
| Seasonal operator | 1.60x to 2.60x | Peak-and-trough | Pre-season cash | Cash and inventory before peak |
The calculator estimates how the main operating levers change liquidity without changing the basic balance-sheet formula.
| Lever | Formula effect | Fast estimate | Operational caution |
|---|---|---|---|
| Collect receivables faster | Lower AR, raise cash | Daily sales x days saved | Do not harm key customer relationships. |
| Turn inventory faster | Lower stock held | Daily direct spend x days saved | Avoid stockouts and rush replenishment. |
| Negotiate supplier terms | Raise AP temporarily | Daily direct spend x extra days | Keep terms documented and reliable. |
| Refinance short-term debt | Lower current liabilities | Moved amount improves ratio | Review total interest and covenants separately. |
| Reduce prepaid buildup | Lower current assets but preserve cash | Cash retained equals avoided prepay | Check discounts and service continuity. |
Running out of money to pay employees doesn’t mean you aren’t seeing something on your balance sheet. Revenue isn’t cash, profit isn’t survival.
Working capital levels breathes life into the business, showing how many current assets can cover short-term liabilities. That’s the oxygen in the company.
Understanding Working Capital
If you don’t understand that number, look at the operational mechanics behind it. The calculator above will crunch those numbers for you based off what you input as your assets and liabilities. It’s basic math with big consequences.
Subtract your current liabilities (like accounts payable) from your current assets (like accounts receivable and cash). If you gets a positive number, that indicates a buffer. But a positive number doesn’t mean you’re healthy. That working capital number can be huge… but it could also represent a bunch of slow moving inventory stuck in a cycle. Your receivables might be disputed, and won’t turn into cash for months.
The tool identifies the operating requirement. It removes the noise, and reveals how much cash is locked up on a day-to-day basis. It differentiates between the cash that’s needed to operate versus the cash that’s needed for growth. This is the context.
That’s why we let you choose your business on the calculator. Is your company a manufacturer with raw materials? Is it a service firm? Different industry types has different norms for what makes a “healthy” current ratio (see reference table). Some industries have lower ratios (e.g., software companies may keep little to no physical stock). You should of benchmark yourself against others in your own industry. Not some abstract ideal.
Now let’s consider the “cash buffer” input. The cash buffer is your safety net for any unexpected shocks. You don’t want to run out of money if one of your clients pays late. On the flip side, you also don’t want to leave idle money sitting around. That’s inefficient, and could earns a return somewhere else. So there’s a tradeoff: between efficiency vs. Security.
Most folks undervalue the lag between money going into their business vs. It is coming out. There’s a leaky valve between collecting payments from customers and paying their supplier. Shortening this gap every day creates substantial liquidity.
To improve their working capital, you have to push on several fronts. You can accelerate your collections (this involve being disciplined about when you send invoices). You can negotiate for longer supplier payment terms (this relies on good supplier relations). You can reduce inventory by improving predictions (this involves getting accurate predictions).
The calculator makes the tradeoffs concrete. How much does each extra day of payables hurt? How much does each extra day of receivables help? What’s the net effect on your working capital? And it translates abstract “habits” into tangible financial results.
Working capital management is a matter of rhythm, the beat of the company’s heart. When the pulse is strong and even, it is better able to weather storms. When the pulse is weak or erratic, otherwise healthy companies can collapse.
Diagnosis: Where are we today? Prescribe fix: apply your operating know-how to find root causes. The numbers tell you where cash is pooling. You have a choice: get it flowing again. Tighten the cycle. Make the buffer honest. Make the cash work for you.