Current Ratio Calculator
Calculate current ratio from current assets and current liabilities, then review working capital, target liability capacity, quick ratio, cash, AR, inventory, liability mix, and inventory write-down sensitivity.
🎯Current Ratio Presets
🧮Current Asset And Liability Inputs
Benchmarks only guide interpretation; the math uses your entries.
Use balances from the same balance sheet date.
Include operating cash that is available within one year.
Short-term investments that can be converted to cash quickly.
Use collectible trade receivables, net of obvious disputes if known.
Stress-test uncollectible receivables without changing the ledger value.
Include inventory expected to sell or convert within the operating cycle.
Shows sensitivity if inventory is not fully realizable.
Prepaids, deposits, tax receivables, and other current items.
Vendor bills, inventory payables, and operating payables due soon.
Include bank debt and notes payable due within one year.
Accrued wages, benefits, utilities, commissions, and closing accruals.
Include sales tax, income tax payable, deposits, or deferred revenue.
Principal, lease payments, or term loan amounts due within one year.
Target liability capacity equals current assets divided by this ratio.
Stress mode changes the adjusted ratio card and comparison grid.
🔢Balance Sheet Snapshot
📊Liquidity Comparison Grid
📐Formula Breakdown
📋Asset Component Breakdown
| Current Asset Component | Entered Value | Share Of Current Assets | Liquidity Quality | Current Ratio Role |
|---|---|---|---|---|
| Cash | $0 | 0% | Immediate | Strongest support |
| Accounts receivable | $0 | 0% | Collection dependent | Watch aging quality |
| Inventory | $0 | 0% | Sale dependent | Sensitive to write-downs |
🧾Liability Component Breakdown
| Current Liability Component | Entered Value | Share Of Current Liabilities | Payment Pressure | Review Point |
|---|---|---|---|---|
| Accounts payable | $0 | 0% | Vendor timing | Review payables aging |
| Short-term debt | $0 | 0% | Financing timing | Check renewal risk |
| Accrued expenses | $0 | 0% | Payroll and close | Confirm due dates |
🚦Inventory Write-Down Sensitivity
| Inventory Write-Down | Inventory Reduction | Adjusted Current Assets | Adjusted Current Ratio | Working Capital After Stress |
|---|---|---|---|---|
| 0% | $0 | $0 | 0.00x | $0 |
| 10% | $0 | $0 | 0.00x | $0 |
| 25% | $0 | $0 | 0.00x | $0 |
📈Current Ratio Interpretation Table
| Current Ratio Range | Liquidity Signal | What It Often Means | Useful Cross-Check | Potential Action |
|---|---|---|---|---|
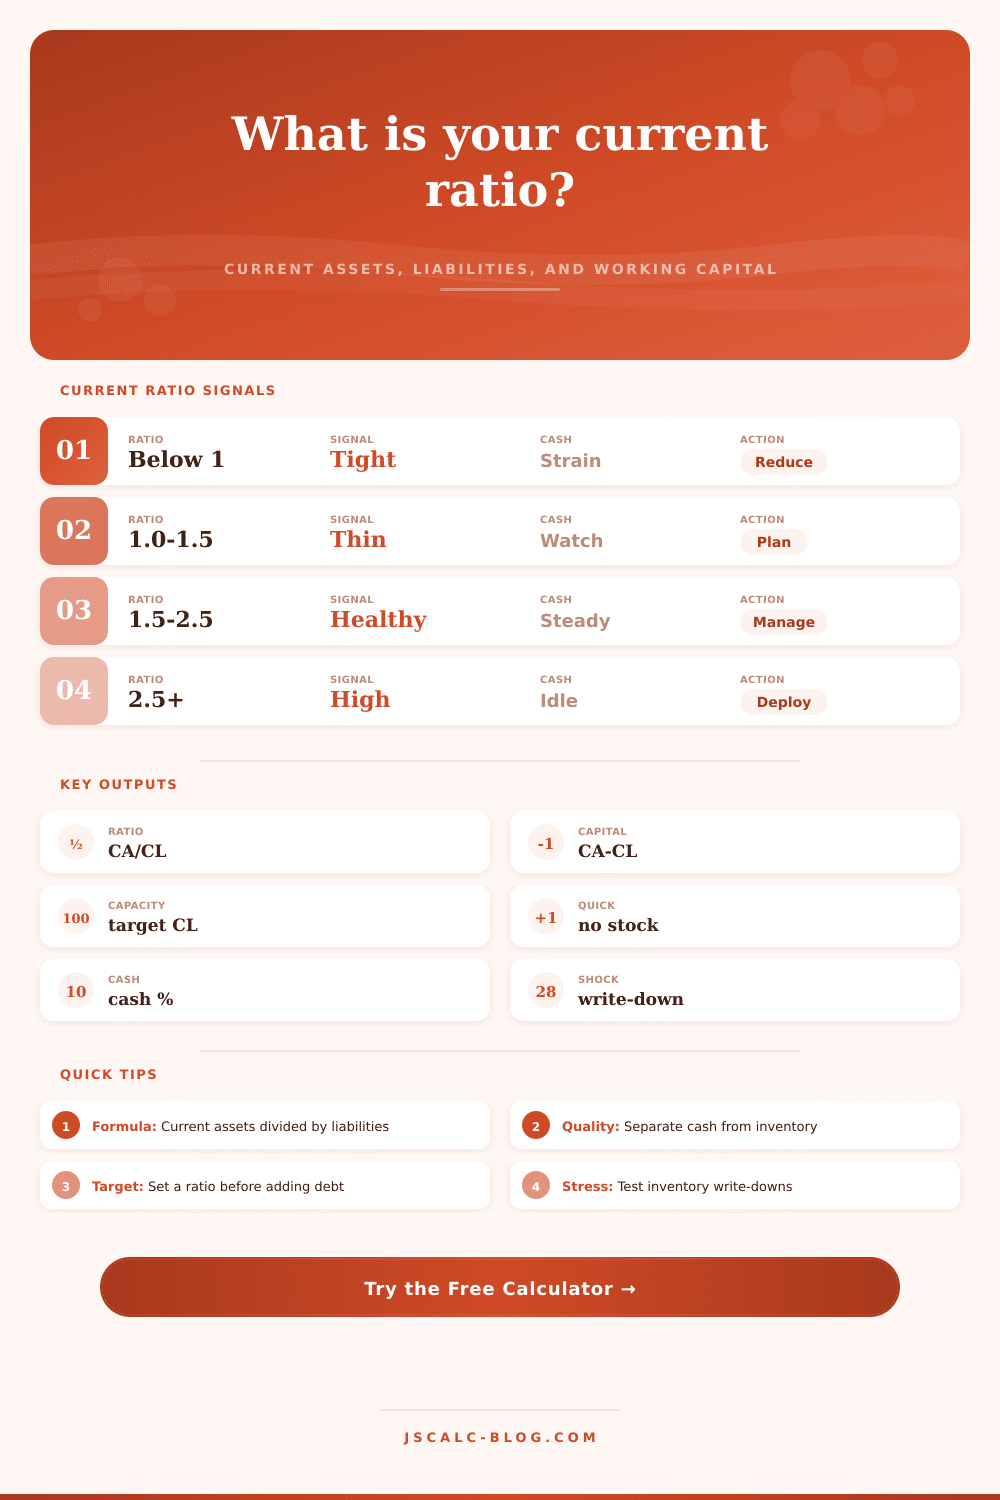
| Below 1.00x | Current liabilities exceed current assets | Near-term obligations may require new cash, faster collections, or delayed payments | Daily cash forecast | Reduce payables pressure and review debt maturities |
| 1.00x to 1.49x | Thin cushion | The company has a margin above liabilities, but little room for collection or inventory delays | Quick ratio and AR aging | Build cash reserve or lower short-term debt |
| 1.50x to 2.50x | Common healthy range | Current assets comfortably cover current liabilities for many operating businesses | Working capital trend | Manage component quality and turnover |
| 2.50x to 4.00x | High liquidity | There may be a large cushion, but cash, inventory, or receivables could be underused | Return on working capital | Review idle cash, slow inventory, and credit policy |
| Above 4.00x | Very high cushion | Could indicate conservative liquidity or inefficient current asset deployment | Inventory turns and cash plan | Confirm assets are productive, not stale |
🔍Input Quality Reference
| Input Area | Use This | Avoid This | Why It Matters | Related Metric | Best Follow-Up |
|---|---|---|---|---|---|
| Cash | Available operating cash and bank balances | Restricted cash needed for another obligation | Unavailable cash can overstate immediate liquidity | Cash ratio | Review bank restrictions |
| Marketable securities | Liquid securities expected to convert within a year | Long-term investments or locked deposits | The current ratio assumes near-term liquidity | Quick ratio | Check settlement timing |
| Accounts receivable | Collectible AR after known disputes | Old or uncollectible balances at full value | AR quality can make the ratio look better than cash reality | AR share | Read the aging report |
| Inventory | Inventory expected to sell or convert in the operating cycle | Obsolete, damaged, or slow-moving goods at full cost | Inventory is often the largest current-ratio uncertainty | Stress ratio | Run write-down sensitivity |
| Payables | Vendor balances due within normal terms | Past-due items hidden in ordinary payables | Past-due payables can signal cash pressure before ratio changes | AP share | Review payable aging |
| Current debt | All principal and notes due within one year | Long-term debt without separating current maturities | Missing maturities understates current liabilities | Debt share | Check loan schedules |
💡Current Ratio Tips
Balance Sheet: You may glance at someone’s balance sheet and notice that their current assets are twice as large than their liabilities (current ratio = 2) and decide that they’re in a rock-solid financial position. Then, you’ll glance at another person’s balance sheet and notice that they only has one dollar in cash for every dollar of debt (current ratio = 1), so they’re surely going to die. The truth is almost always somewhere in between and the details makes all the difference.
Sometimes, it’s simply a question of quality of assets on your paper. Sure, you might have a current ratio of two, but can you convert those asset into cash fast enough when bill comes due? The calculator up top will crunch numbers for you. But true insight is understanding story within the numbers.
Look at the Details, Not Just the Number
The real problem goes beyond simple current ratio (current assets/ Current Liabilities). Sure, everybody does that calculation: divide current assets over current liabilities to get a number. But there’s more. It’s about composition.
Maybe 50% of your current assets is sitting on a shelf, collecting dust, slow-turning inventory. You’ve got a two-to-one current ratio, so everything seems fine … except now you know that that inventory might not move for another six months. Your accounts payable need to be paid within thirty days. What you have versus what you owe isn’t just a question of numbers, it’s one of time.
By breaking out the pieces, showing you cash, inventories, receivables, etc., the tool can help you see exactly how liquid you really are. The ratio tells you what that number is.
But what about dollar amount. The working capital? But what about the dollar amount, the working capital? Sure, you could have a healthy ratio but be thin on your working capital as a large company (because base numbers is so big). Or maybe you’re a small business and has a lower ratio but still have such a good supply of actualy cash you’ll cover the next three payrolls with no sweat.
The working capital number shows up right there beside the ratio on the calculator; it’s the absolute financial buffer you have. And that makes all the difference when you ask yourself whether you should of tightened up on collections or whether you can take on another loan.
The final element is the stress test. Here’s where everyone skips ahead. You input your inventory value, then tell the tool what percentage of it should be written down (because in a downturn, inventories tends to become obsolete, or at least lose value). If your ratio stays at or above one after this inventory adjustment, great. You’re fine. But if it falls below one, you have a fragile situation, hidden behind rosy-looking book values.
For service-based businesses that don’t hold stock, the quick ratio eliminates inventory altogether and focuses just on receivables plus cash. It is harsher, yes, but often more honest as well. The reference table on the page sets out those ratios. A number under one signals strain, and a number over two point five might suggest idle cash that could be put to work somewhere else.
For example, the target liability capacity feature is realy cool for planning: instead of “what’s my ratio?” it lets you ask “how much debt can I safely take on?” You enter a target ratio (e.g., one point five), and it tells you max amount of liabilities that your existing level of assets can handle. That converts the ratio from a retroactive scorecard to a future constraint, helping prevent yourself from taking on too much debt in advance of signing a contract.
In the end, liquidity is all about flexibility and survival. A high ratio is good…if the assets can be realized. A low ratio is bad, but it is manageable if you can access credit and speed up collections. So your operating context provides meaning to the numbers, which provide a snapshot. Whether you are in retail with heavy seasonal stock or in services with tight cash flow, the goal is the same.
Cash flow may be tight, but the goal is the same. Do you know exactly how much runway you have? That’s the piece that people gets wrong; they focus on the headline number rather than the quality of the assets backing it.
The math is simple, but the strategy is in the details. Look at not just your averages, but your stress points. Check those too.