Vesting Schedule Calculator
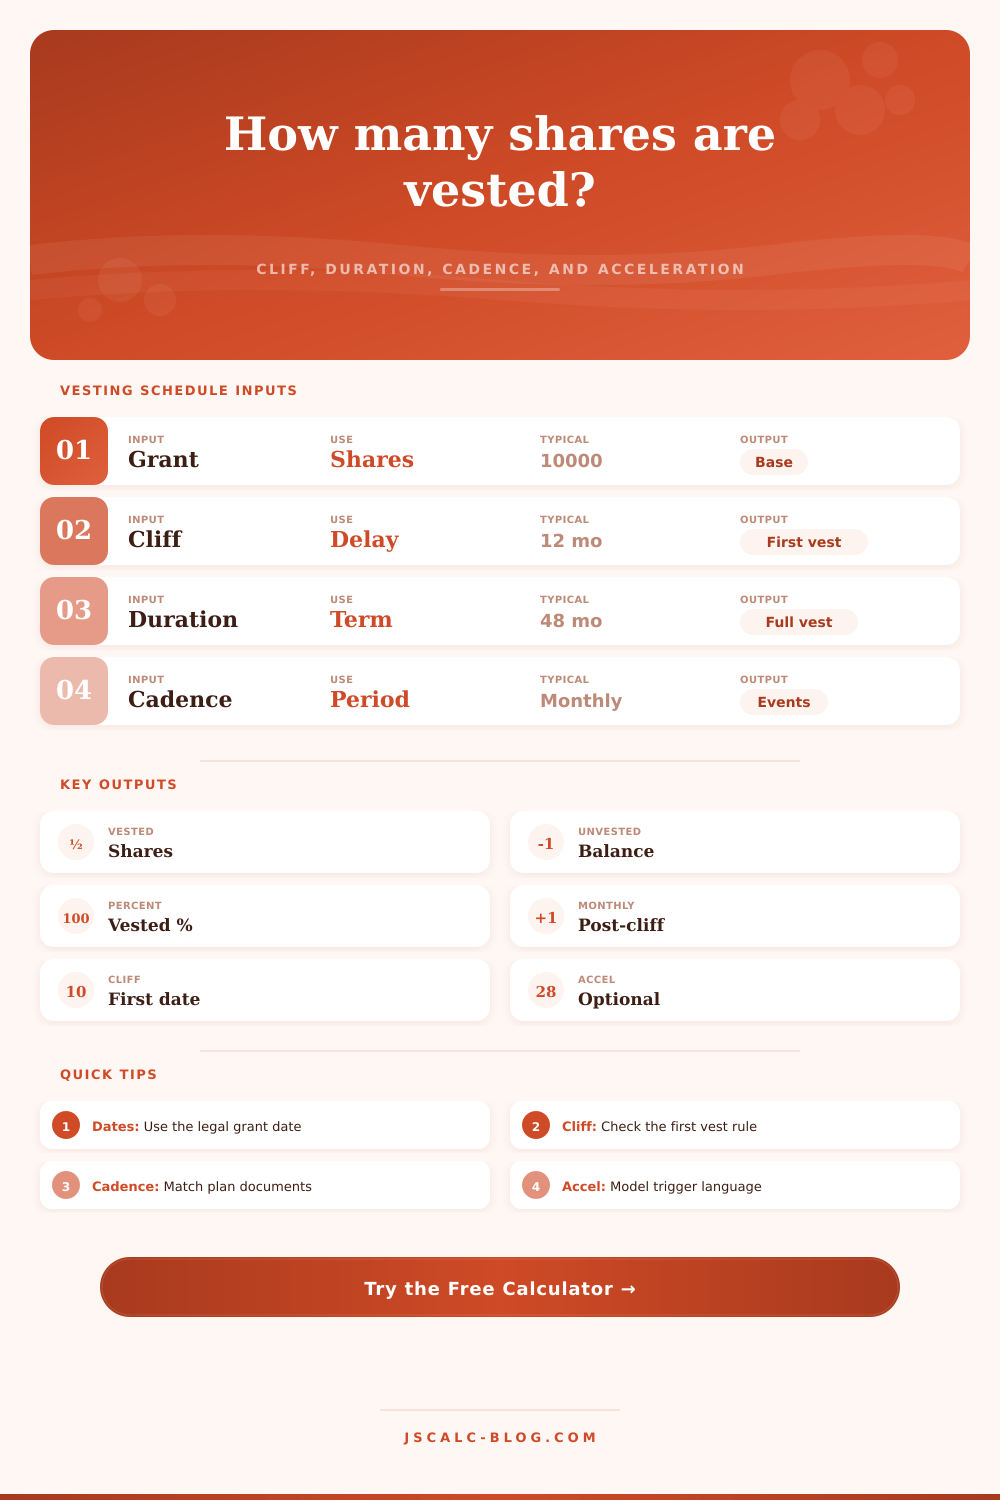
Estimate vested shares, unvested shares, cliff release, post-cliff vesting per period, acceleration, and next vesting events from one grant schedule.
| Event | Date | Month | Scheduled vest | Cumulative vested | Percent vested |
|---|
| Calendar year | Scheduled shares vesting | Acceleration shares | Year-end vested | Year-end unvested |
|---|
| Scenario | As-of / stop date | Vested shares | Unvested shares | Vested percent | Note |
|---|
| Frequency | Months per period | 48-month post-cliff periods | Typical use | Calculator treatment |
|---|---|---|---|---|
| Monthly | 1 | 36 after 12-month cliff | Startup options | Small equal releases after cliff |
| Quarterly | 3 | 12 after 12-month cliff | RSUs and refresh grants | Groups three monthly equivalents |
| Semiannual | 6 | 6 after 12-month cliff | Restricted stock plans | Larger twice-yearly releases |
| Annual | 12 | 3 after 12-month cliff | Board or retention grants | One scheduled release per year |
| No cliff monthly | 1 | 48 in a 48-month plan | Refresh grants | First vest after first full month |
| Upfront plus rest | any | based on remaining term | Founder reverse vesting | Upfront shares count immediately |
The compensation package looked good in black-and-white. You inked the offer letter. But then there’s the delayed reward that comes with a cliff, a wait before the equity grant becomes visible, most of which is still obscured during Year 1.
The cliff is a retention tool; it assumes you’ll hang around until you’ve made some sort of contribution. That’s how most folks misunderstands it. No, they’re not cashing in their equity each month, starting Day One. They’re building up the potential to earn it. It’s an important difference to understand if you want to figure out what all that paper wealth mean.
Why Vesting Cliffs Matter
Once you input your date range (and assuming you know exactly what size grant you’ve been given), calculator does the math for you. The thing about cliffs: they’re typically twelve months in length and you have to know the exact day on which you acquire shares. Month eleven? You walk away with zero dollars. Month thirteen? You walk away with 25% of the grant. That one month can be a brutal switch. From a major asset to a hole in your bank account.
Once past the cliff, the vesting slows to a trickle. Some companies vest monthly; other plans are quarterly. Match the frequency on the tool to your actual plan document as that determines both your tax timing and when you’ll get money in hand (i.e., liquidity events).
Even though you may have exactly the same dollar amount in four years, the time at which that happens matters, so does your mental model of what’s vested. If you imagine things vest monthly but your company issues shares on a quarterly schedule, then you’re out of sync with reality by 3 months. That mismatch lead to bad decisions.
The wild card is acceleration. While extremely rare (and typically resulting from a change of control, i.e. An acquisition), it’s also the game-changer when it occurs. Typically, there are two kind: single-trigger (immediate vesting on sale; no matter if you lose your job) and double-trigger (sale plus subsequent termination). Most plans written today is double-trigger to protect the buyer’s interest. You should of modeled for both. If your numbers become unrealistic when you model for full acceleration, you have modeled for the wrong scenario!
The stop date is when termination ends the clock. Vesting stops on termination (for cause or voluntary). Any unvested shares vanish. The tool enables you to specify a stop date. How many would you keep if terminated tomorrow? Next week? Next year? That’s critical information for negotiating, you want to know the exact cut-off. Thousands of dollars might be at stake, depending on whether it’s one day before vs. One day after a vesting event.
The rounding rules may sound obvious, but they’re not. While some plans will round the number of shares up to the next whole number, others will floor them. Those small fractions accumulate into a large difference in your cap table status over the span of four years. Read your plan: what does it say? Lawyers will argue this little detail. Argue with them.
Cash isn’t equity. Equity is a claim on future value. The vesting schedule is your roadmap to that value. It is your exit strategy. It is your leverage during negotiation. It is your risk exposure.
You can’t manage what you don’t measure. Measure it. Run the scenarios with the tool. Test the cliff. Termination. Acceleration. The numbers don’t lie. Just give them your input and they’ll tell you the truth.
Seeing your schedule laid out like this will erase uncertainty. No more guessing. Now you’re planning. And that’s how you turn paper promises into real wealth.