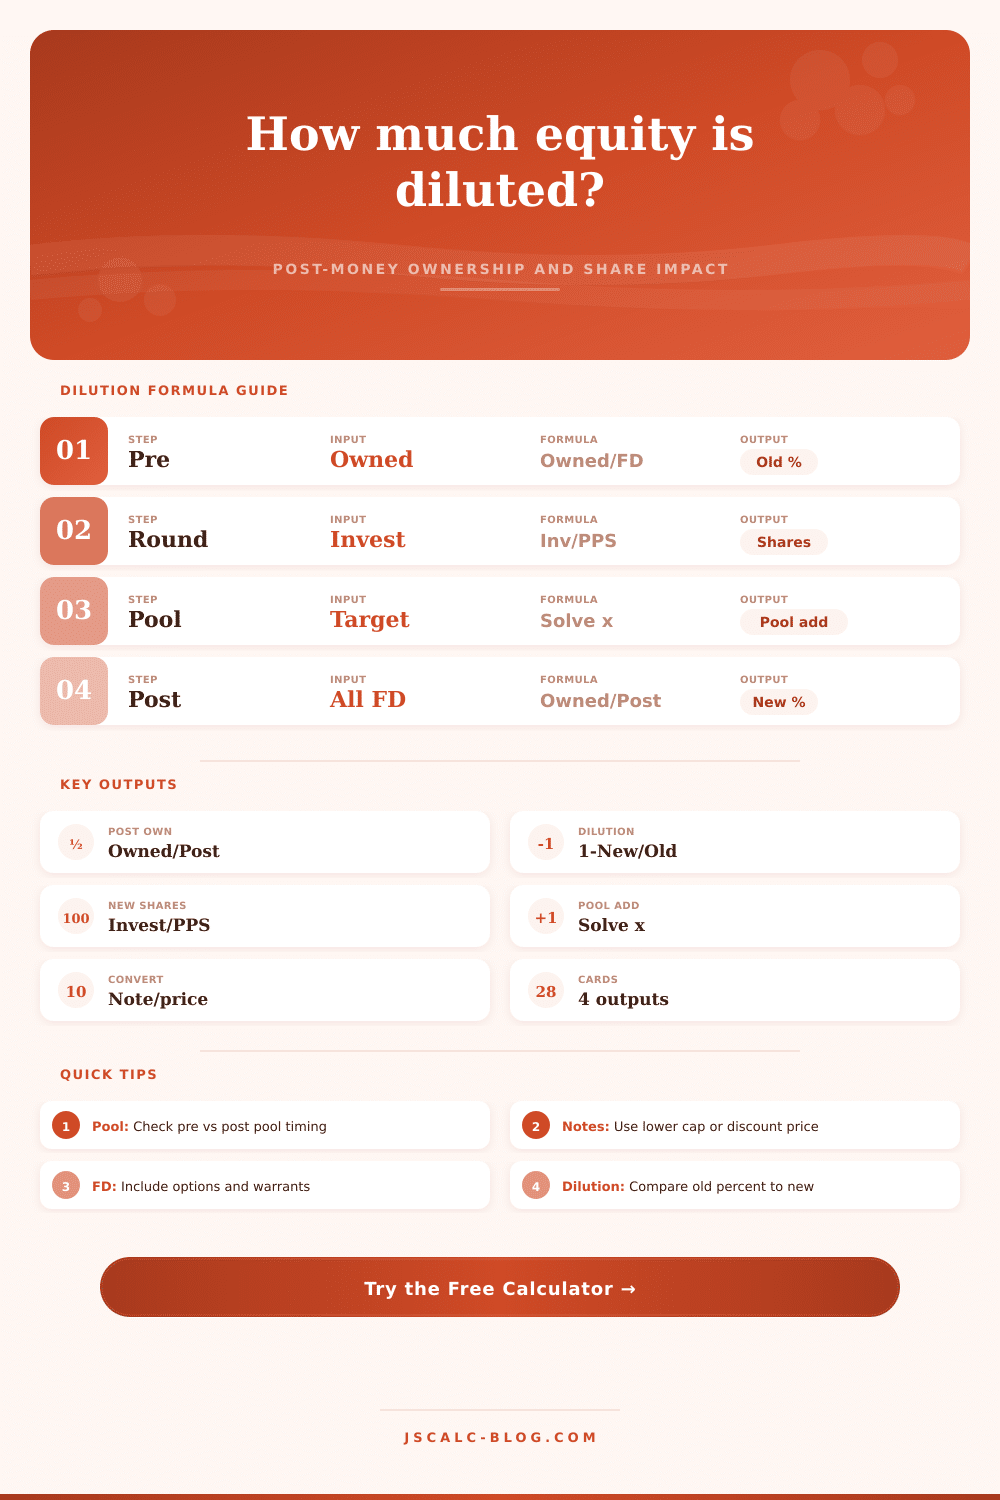
Equity Dilution Calculator
Estimate post-financing ownership after new investment shares, option pool expansion, and convertible note or SAFE conversion shares.
Presets are illustrative cap-table cases. Replace them with your fully diluted share count, share price, and legal terms before relying on the result.
Shares owned divided by pre-financing fully diluted shares.
Extra option shares required to hit the target pool percentage.
Principal divided by the lower conversion price from cap or discount.
New investment shares as a share of post-financing FD shares.
Pre-ownership percent minus post-ownership percent.
Price per share multiplied by post-financing fully diluted shares.
Existing plus expanded option pool divided by post-financing FD shares.
Additional shares needed to reach the target ownership after the round.
| Holder group | Pre shares | Pre ownership | Post shares | Post ownership | Change |
|---|---|---|---|---|---|
| Run the calculator | - | - | - | - | - |
| Scenario | Post FD shares | Holder post % | Relative dilution | Investor % | Pool add |
|---|---|---|---|---|---|
| Run the calculator | - | - | - | - | - |
| Formula | What it compares | Expression | Why it matters |
|---|---|---|---|
| Pre ownership | Owned shares before the financing | Owned / pre FD | Baseline percentage before new securities are added. |
| New shares | Priced round investment | Investment / PPS | Creates the investor block added to the cap table. |
| Post-money ownership | Owned shares after financing | Owned / post FD | Core output requested by most founders and employees. |
| Point loss | Absolute ownership decrease | Pre % - post % | Shows percentage points lost on the cap table. |
| Relative dilution | New ownership versus old ownership | 1 - post % / pre % | Shows the proportion of the old stake diluted away. |
| Post-money value | Round share price across post FD shares | PPS x post FD | Translates the share model into implied valuation. |
| Option pool treatment | Share-count effect | Dilution borne by | Calculator method |
|---|---|---|---|
| No expansion | Existing pool stays fixed | No added pool dilution | Set target option pool after round to 0. |
| Post-money target | Solves pool after new and convertible shares | All post holders share the pool percentage | x = (target x base - existing pool) / (1 - target). |
| Pre-money negotiated pool | Often added before pricing documents close | Existing holders usually absorb more impact | Compare with the no-pool and target-pool scenarios. |
| Refresh after financing | Board adds shares later | Everyone then outstanding is diluted | Model by rerunning with the investment set to 0. |
| Oversized pool | Unissued shares still count in fully diluted math | Existing holders and new investors both see lower percentages | Keep current pool shares inside pre-financing FD shares. |
| Convertible term | Conversion price | Share formula | Modeling note |
|---|---|---|---|
| No discount or cap | Round price | Principal / round PPS | Converts like new money at the financing price. |
| Discount only | Round PPS x (1 - discount) | Principal / discounted PPS | Higher discount creates more conversion shares. |
| Valuation cap only | Cap / pre-financing FD | Principal / cap PPS | Lower cap price creates more conversion shares. |
| Cap plus discount | Lower of cap price and discount price | Principal / lower PPS | This calculator uses the lower price for holder-favorable conversion. |
| Interest or premium | Added to principal first | Adjusted principal / price | Add interest to the principal input when applicable. |
| Round type | Typical dilution driver | Common watch item | Useful input check |
|---|---|---|---|
| Seed priced round | New investor shares plus pool increase | Whether the option pool is pre-money | Target pool often lands around 10% to 15%. |
| Series A | Larger investment and possible note conversion | Cap table includes all SAFEs and notes | Confirm fully diluted shares before calculating PPS. |
| Bridge conversion | Discounted conversion shares | Discount and cap may both apply | Use the lower conversion price if terms allow it. |
| Employee grant | Company-level dilution from later rounds | Grant percent changes as FD shares grow | Enter grant shares as shares owned. |
| Late-stage round | Large pre-FD base but bigger checks | Secondary sales may not add shares | Exclude secondary cash if it buys existing shares. |
| Down round | Lower price creates more new shares | Anti-dilution rights can add shares | Add adjusted shares to pre FD if already triggered. |
There’s a point in every entrepreneur’s journey at which startup math cease to be abstract, and begins to feel very personal, typically just prior to signing your seed round term sheet. After months of iteration, building out a product and hiring staff based on a vision, you’ve come to terms with the fact that taking money will shrink your slice of pie. Raising isn’t a penalty for success. It’s the price you pay for gaining velocity. The trick is knowing precisely how much velocity is worth purchasing.
When most founders go into this conversation they kind of have a ballpark estimate for how many shares they own, but it’s never exact because they don’t understand what fully diluted share count is. The difference between the fully diluted share count and the actual share count is where everyone gets screw up. Fully diluted means all the reserved shares in the option pool plus all the warrants plus all the options outstanding plus all the common stock currently issued. So if you’re just looking at common stock issued, you will be over-estimating your ownership. Most people leave out that piece, they believe they own 40% of the company, but when we account for the options and warrants, it turns out they actualy own 35%.
Understanding Startup Ownership Math
Enter the calculator. After you enter your share count before financing, the calculator crunches the numbers so you don’t show your investors an incorrect cap table. That’s where things get complex. You must also consider the possibility of expanding the option pool. Nearly every VC will ask for expanded pool so they have more shares to issue to new employees once funding closes. How do you allocate this dilution? If you expand the pool with pre-money shares, then you absorbs the dilution as an owner. If you expand the pool using post-money shares, however, then the VC eats a portion of this cost. Using the tool, you’re able to specify the desired size of the new pool and solve for how many new shares it requires.
Why does it matter? A 10% increase in the pool could cut a few points of ownership that seem baked-in but don’t actualy represent any issued shares yet. This is a choice: you’re giving up today’s ownership in exchange for increased ability to hire in the future. It’s a strategic trade-off, more different than a loss.
There’s also one other wrinkle in the frictional equation: convertible notes and SAFEs. They are structured to convert into equity using either a valuation cap or a discount. In other words, whoever owns them gets more shares if it converts on the cap then what you’d recieve from simply doing a price-per-share calculation. That means even more dilution for everybody except those who converted early. To know how much you own post-money, you’ve got to model the conversion correctly. If you don’t take into account the convertible principal when you’re modeling your ownership, then you’re staring at a fake valuation. The table on the page spells this all out clearly, how changing terms for converting changes the number of shares.
It is important to understand the difference between relative dilution and point loss. An eight-point drop from 40% to 32% represents a twenty percent relative dilution. This is the metric that matters for your economics. You will still be in a better position if your relative piece shrinks by 20% and your valuation doubles. This is where you can balance out the numbers against the growth using the calculator, it shows both metrics.
The numbers don’t have to be scary. Remember, equity is just a means to an end (not an end unto itself). A bigger piece of a stagnant company is far worse than a smaller piece of a booming one. Test your comfort levels. Run some scenarios. Get familiar with how the deal works. And then tuck it away and get back to building. Math is simply the floor plan. You’re responsible for building the house you should of planned.