Business Valuation Multiple Calculator
Estimate enterprise value from EBITDA or revenue multiples, convert it to equity value after debt and cash, then test growth, risk, minority interest, illiquidity, and ownership stake adjustments.
🎯Valuation Scenario Presets
🧮Business Valuation Inputs
Choose the primary formula used for enterprise value.
Loads reference midpoint multiples for the selected profile.
Use normalized EBITDA after owner add-backs and one-time items.
Use trailing 12 months or forward revenue consistently.
Enterprise value = EBITDA × EV/EBITDA multiple.
Enterprise value = revenue × revenue multiple.
Only used when the blend method is selected.
Raises or lowers the base value for growth versus peers.
Discount for customer concentration, cyclicality, or weak controls.
Debt is subtracted when converting enterprise value to equity value.
Cash is added after debt is subtracted.
Use when valuing a non-control ownership position.
Use when the stake is hard to sell or transfer.
Applies after enterprise value, net debt, and discounts.
Changes displayed values only; formulas use full amounts.
📌Current Valuation Snapshot
📊Industry Multiple Comparison Grid
🗂Preset Scenario Comparison
| Scenario | Method | EBITDA | Revenue | Base Multiple | Debt | Cash | Common Read |
|---|---|---|---|---|---|---|---|
| Main Street Services | EBITDA | $1.25M | $8.2M | 5.2x EBITDA | $2.1M | $650k | Normalized cash earnings drive value |
| Growth SaaS | Revenue | $3.2M | $24.0M | 5.5x sales | $1.2M | $6.5M | Revenue multiple dominates growth story |
| Precision Manufacturing | EBITDA | $8.4M | $68.0M | 6.4x EBITDA | $18.0M | $4.0M | Asset base and backlog support mid-market multiple |
| Healthcare Practice | EBITDA | $2.6M | $14.0M | 6.8x EBITDA | $3.8M | $1.1M | Provider retention and payer mix matter |
| Ecommerce Brand | Blend | $1.8M | $19.5M | 45% EBITDA | $2.4M | $1.9M | Profitability and revenue scale both checked |
| Marketing Agency | EBITDA | $900k | $6.0M | 4.6x EBITDA | $350k | $500k | Owner transition and client churn shape risk |
| Restaurant Group | EBITDA | $1.6M | $18.0M | 3.8x EBITDA | $5.2M | $850k | Lease obligations and unit economics need review |
| Industrial Distributor | EBITDA | $5.7M | $82.0M | 5.9x EBITDA | $12.0M | $2.2M | Working capital and supplier concentration matter |
| Minority Stake | EBITDA | $4.5M | $32.0M | 6.0x EBITDA | $7.0M | $1.4M | Discounts apply after control equity value |
⚖Multiple Selection Table
| Profile | Typical EV/EBITDA | Typical EV/Revenue | Use EBITDA When | Use Revenue When |
|---|---|---|---|---|
| Local services | 3.0x to 5.5x | 0.35x to 0.90x | Owner earnings are normalized | Margins are temporarily distorted |
| SaaS | 8.0x to 18.0x | 3.0x to 9.0x | Business is profitable at scale | Retention and growth are the story |
| Manufacturing | 4.5x to 8.0x | 0.60x to 1.40x | Margins are steady | New capacity depresses EBITDA |
| Healthcare practice | 5.0x to 9.0x | 0.70x to 1.60x | Provider productivity is stable | EBITDA includes unusual staffing changes |
| Ecommerce brand | 4.0x to 8.5x | 0.70x to 2.50x | Contribution margin is durable | Revenue quality and repeat purchase lead |
| Agency or professional firm | 3.5x to 7.0x | 0.45x to 1.10x | Client retention supports earnings | Revenue is recurring but hiring is ahead |
| Restaurant or hospitality | 2.5x to 5.0x | 0.25x to 0.80x | Store-level profit is mature | New units have not seasoned yet |
| Industrial distribution | 4.0x to 7.5x | 0.35x to 0.95x | Working capital needs are normal | Gross margin is stable but EBITDA is noisy |
📐Formula Method
🔍Adjustment Reference Table
| Adjustment | Low Range | High Range | What It Captures | Where It Applies |
|---|---|---|---|---|
| Growth premium | 0% to 5% | 15% to 35% | Growth above comparable companies | Before debt and cash |
| Risk discount | 3% to 8% | 20% to 40% | Concentration, churn, cyclicality, or controls | Before debt and cash |
| Minority discount | 5% to 15% | 20% to 35% | Lack of control over decisions and exits | After equity value |
| Illiquidity discount | 5% to 12% | 20% to 35% | Hard-to-sell private ownership interest | After ownership share |
| Net debt adjustment | Debt minus cash | All interest debt | Claims ahead of common equity | EV to equity bridge |
| Working capital target | Deal-specific | Deal-specific | Normal operating liquidity needed at closing | Usually separate from this screen |
📋Valuation Quality Checklist
| Check | Clean Input | Risk Signal | Why It Matters |
|---|---|---|---|
| Metric period | TTM or forward is clearly labeled | Mixes past EBITDA with forward multiple | Period mismatch can overstate value |
| EBITDA quality | Owner add-backs are supportable | One-time add-backs repeat annually | Multiple valuation magnifies every adjustment |
| Revenue quality | Recurring or repeatable customers | One-time project revenue dominates | Revenue multiple assumes durable sales |
| Balance sheet bridge | All interest-bearing debt included | Cash needed for operations is added back | Equity value depends on debt and excess cash |
| Control level | Control and minority values are separated | Control multiple applied to small stake | Minority positions usually need a discount |
| Comparable set | Similar size, margin, growth, and risk | Public-company multiple applied unchanged | Private businesses often trade differently |
💡Business Valuation Tips
There’s no way around it, buying a company is an act of tremendous uncertainty. Your best bet to make a good purchase is to use some kind of metric to help you along. Generally, there will be a gap between what you are willing to pay and what the seller want to sell for. That difference should of been filled with information, not hope. Multiple help fill that gap.
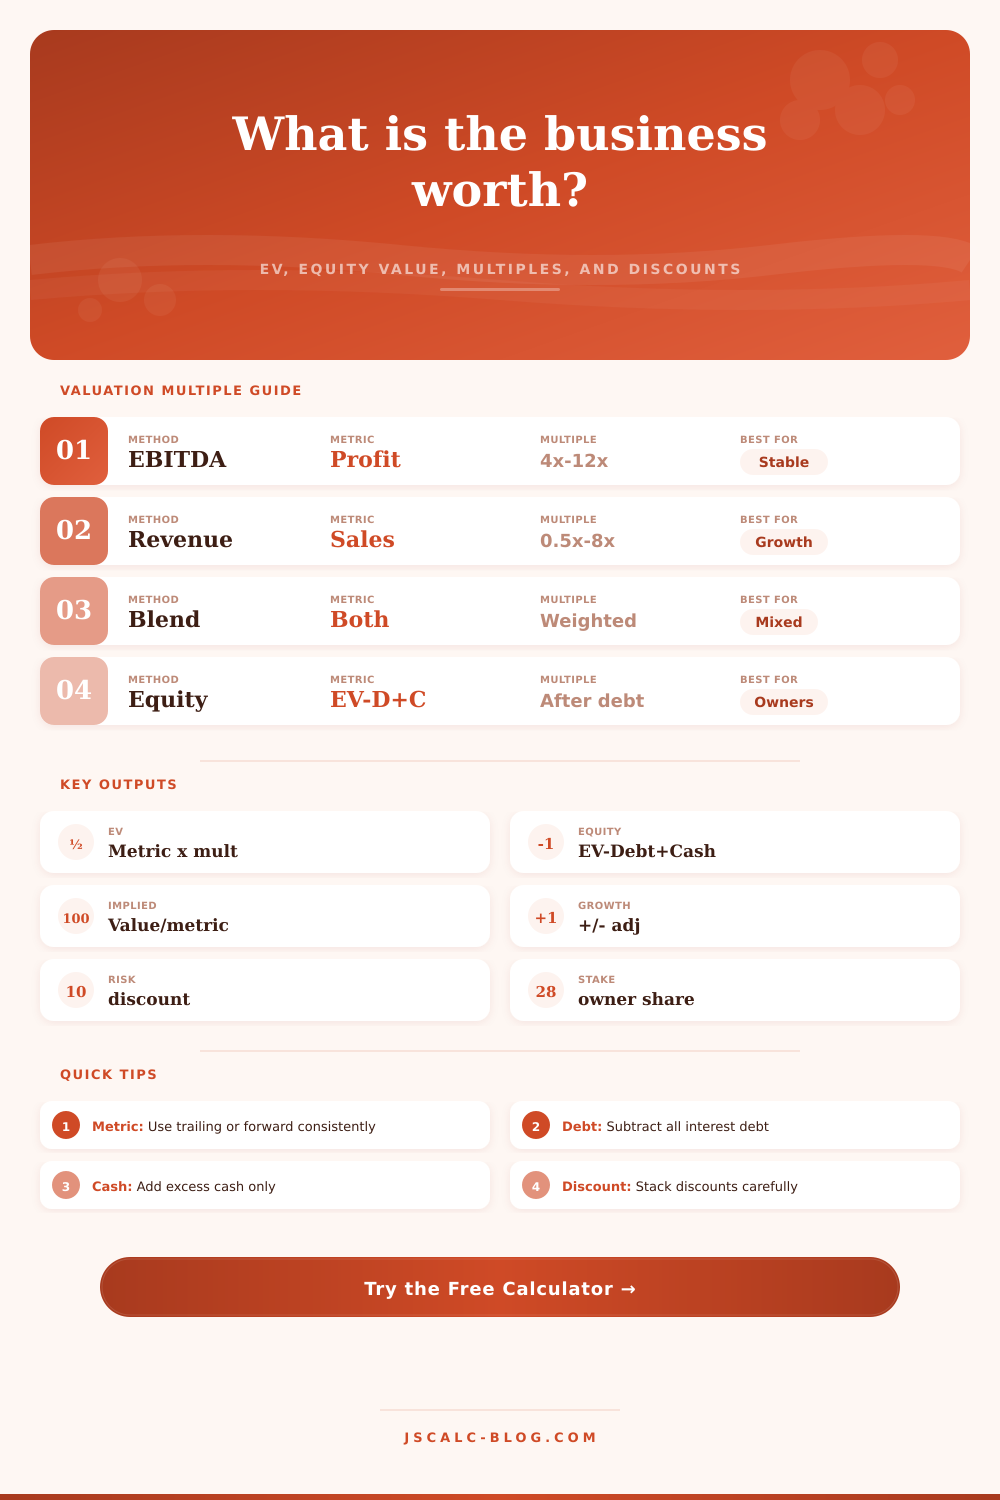
A multiple turns cash flow into a dollar amount to give you the data. It’s not always easy math. Before you know what valuation is, you need to know what you’re getting. EBITDA (earnings before interest, taxes, depreciation and amortization) is what most buyers begin with. It strips out accounting differences to reveal actual cash generated by business. While the calculator do it for you, the heavy lifting comes in getting those numbers right.
How to Use Multiples to Value a Business
Get normalized EBITDA. That means plugging in one-time legal costs, excess travel and any other personal expenses that belongs to the owner. Buyers is going to question these numbers in due diligence. Don’t confuse the issue by trying to get a above-average multiple like many others do. Instead ensure there is solid foundation of earnings.
There’s no one-size-fits-all multiple. It all depends on industry context. If you buy a local service company, where its valuation is tied to owner’s day-to-day work, you could pay 3-4x EBITDA. For a software company with recurring revenue, you can pays 8x+ since their cash flows into the future are predictable. As reference table shows, these multiples get affected by growth prospects and capital intensity of your business.
Don’t treat a manufacturing business as if it were a tech business. Think about the asset base. Does it have heavy equipment? That add value. It also increases debt, which decreases equity. That’s the difference between equity value vs. Enterprise value. Enterprise value = total cost of the acquisition (including debt). Equity value = what’s left over for the owners after subtracting debt, then adding back any cash reserves they hold.
The final number will depend on growth and risk adjustment factors, which require thoughtful analysis of market. For example, a 10% annual growth rate for a company in a stable market is worth more than a 5% growth rate in a volatile market. A company with high degree of reliance on one customer deserves a discount. (These adjustments aren’t random; rather, they guard against uncertainty.)
If you’re purchasing a minority interest, you’ll want to consider a discount for lack of control and illiquidity: It’s not like you can sell your piece at will, nor force the seller to accept an offer. The calculator adjusts for these layers one by one just as a professional appraiser would do when dealing with layered risk. This avoids a potential mistake that might cause you to overvalue or undervalue the investment.
This allows you to value hybrid companies, like an e-commerce business that is profitable while also spending money to acquire customers (the blend feature). Then you can use both the revenue and EBITDA methods and weight them against each other to come up with a balanced number. Profit means they’re efficient, whereas revenue shows they have some level of scale. Both metrics alone aren’t perfect, and you should know which one each is measuring. How much are you paying for today vs tomorrow?
Negotiation is half art, half science, with valuation being one of the tools in that mix. The numbers will give you a range, but it’s the negotiations and sense of timing and strategic fit that determine the price. Use this tool to develop a defensible range. Play with multiples. Run what-if scenarios. Vary level of debt and observe impact on the equity value.
If you come to realize what the business is worth under different circumstances, you no longer guess. You now negotiate from strength because you know what to focus on.