Fiscal Quarter Calculator
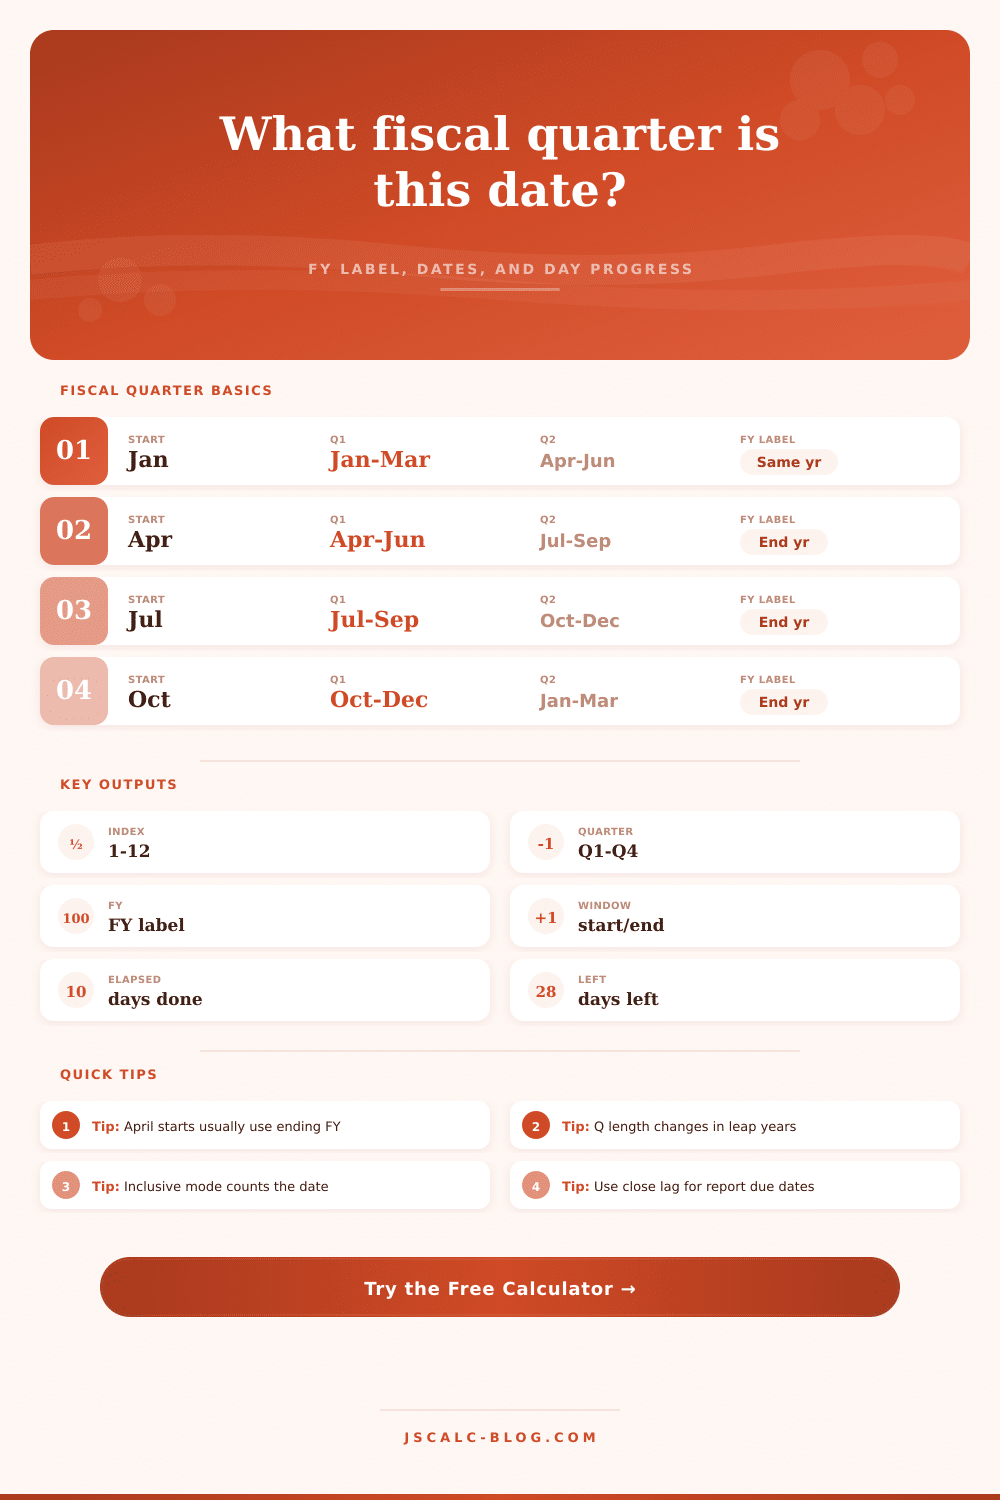
Find the fiscal month index, fiscal quarter, FY label, quarter start and end dates, days elapsed, and days remaining from any calendar date and fiscal year start month.
📌Fiscal calendar presets
📅Quarter inputs
Fiscal quarter result
🧮Current calculation snapshot
🗂Comparison grid
📊Selected fiscal year quarter table
| Fiscal quarter | Start date | End date | Calendar months | Days |
|---|
📆Month to fiscal quarter map
| Calendar month | Fiscal month index | Fiscal quarter | Fiscal month in quarter | FY start anchor |
|---|
📘Common fiscal starts reference
| Fiscal year start | Q1 months | Q2 months | Q3 months | Q4 months |
|---|---|---|---|---|
| January | Jan-Mar | Apr-Jun | Jul-Sep | Oct-Dec |
| February | Feb-Apr | May-Jul | Aug-Oct | Nov-Jan |
| March | Mar-May | Jun-Aug | Sep-Nov | Dec-Feb |
| April | Apr-Jun | Jul-Sep | Oct-Dec | Jan-Mar |
| July | Jul-Sep | Oct-Dec | Jan-Mar | Apr-Jun |
| October | Oct-Dec | Jan-Mar | Apr-Jun | Jul-Sep |
📐Formula and label rules
| Item | Formula or rule | Example | Use |
|---|---|---|---|
| Fiscal month index | ((calendarMonth - fiscalStartMonth + 12) % 12) + 1 | July with April start = 4 | Places any month into 1-12 fiscal order. |
| Fiscal quarter | floor((fiscalMonthIndex - 1) / 3) + 1 | Index 4 = Q2 | Groups fiscal months into four quarters. |
| Ending-year FY | FY label is the year in which the fiscal year ends | Apr 2026-Mar 2027 = FY2027 | Common for government, nonprofit, and many company calendars. |
| Starting-year FY | FY label is the calendar year in which the fiscal year starts | Apr 2026-Mar 2027 = FY2026 | Useful when internal plans name the opening year. |
| Elapsed days | Selected rule controls whether the date itself counts | Inclusive adds 1 day | Keeps finance reports and project dashboards consistent. |
💡Quarter calculation tips
Your business operates on a calendar that doesn’t match the season. It may begin the first quarter of its fiscal year in April and close out the fourth quarter in November. Or maybe it begins a new year on Jan. 1 like most of the world. Regardless, this mismatch creates fiscal confusion: You can identify which month it is now; but not necessarily where that month falls within your company’s financial cycle.
Once you plug in your start month into the fiscal quarter calculator above, it do the math for you. No more messy head-counting with leap years and overlapping year labels.
Why Fiscal Calendars Matter for Your Business
Okay, so there’s the matter of finding the quarter, but that’s not the problem. What’s confusing is the labels. If your fiscal year begins in April, then April through June is the first quarter. Simple enough. But what about naming the year? Maybe it ends in April 2026. Or maybe March 2027. Nonprofit groups and government typically use the ending-year convention. So the fiscal year starting in April 2026 and ending in March 2027 would be labeled as FY2027. This seems backward since the majority of the year occurs during 2026. In fact, it’s common for people to mislabel the year by assuming the label corresponds with the start date.
The calculator include toggles for calendar-year, starting-year, and ending-year conventions. That’s important because one company might call it FY2026 and its finance director will write in that term; another company might call it FY2027 and its partner will type that into the system instead. In both cases, they’re correct inside their system. It’s just the name that’s different… Not the math.
It will break out the specific days of the quarter as well. Why does that matter? Because if you’re tracking milestones or revenue recognition, then it’s important to know what days falls into each month. A quarter isn’t always precisely 90 days long. Sometimes it’s 91. Other times it’s 92. Leap years throws another day into February. When your fiscal year begins in January, Q1 includes February. So that quarter get an additional day in a leap year. If you do burn rate calculations on a per-day basis, not including that day throws off your projections. By accounting for the exact number of days elapsed since the beginning of the quarter, the elapsed days feature does that for you.
You get to decide to include today or consider it a day already passed. That will depend based off if you want to create a report for a close period or a dashboard that’s being monitored live.
The idea becomes real through reporting deadlines. Finance teams typically report with a lag. That means that the reporting doesn’t happen until sometime after the quarter has ended. For example, if the Q2 calendar quarter ends in September, then the books likely won’t be closed before early July. There’s a field in the calculator for the reporting close lag. This allows you to add some buffer to account for closing the books. You’ll get an idea of when the work actualy gets completed. Why? Because it helps you plan resources. Knowing that the company closes its books ten days after the end of the calendar quarter will allow you to plan out reconciliations and audits to match.
On the page there’s a reference table that outlines this for common fiscal start dates. This way you can get a quick visual of how others structure their time across various industries.
Fiscal calendars can be seen as arbitrary administrative barriers that need to be jumped over. They’re not. They represent the calendar of when a business generates revenue. For example, retailers frequently begin their financial year in February so they can include holiday spending in initial quarter. Manufacturers may begin in January to match up with inventory cycles. Knowing which way the calendar matches up will help you understand what the numbers mean. If a retailer has a good Q1, it sold well during the holidays. If a university has a good Q1, it was able to drive successful enrollments. The anchor date changes the meaning of the numbers.
If you are comparing yourself to others, always examine their fiscal calendar before you do. Comparing a calendar-year Q2 to a retailer’s fiscal Q2 is like comparing apples to oranges. That means one is spring growth, the other is summer slump. With this, you can switch between presets on the calculator and instantly see those differences. Jump from a standard calendar year to the UK tax year that starts in April, and watch how the quarters adjust. Investors and analysts needs that kind of perspective shift. It makes them realize they aren’t just dealing with calendar dates but cash flow cycles.
Time gets sliced up into quarters so we can manage it more easily as human beings. A financial quarter is a convenient tool; but it’s still just a tool. It removes the guesswork from how we slice that time. It simply tells us the right labels, the exact boundaries, and the number of days needed to understand the data.
Half the battle when understanding your company’s position in its financial cycle is having the right frame of reference. If you’re preparing a board deck or if you just want to know where your company stands, having the right frame of reference is half the battle. And once you know what the labels and dates are, it allows the story of the business to become much clearer. You no longer have to worry about which year each quarter belongs to. Now you start to focus on whether or not the business is actualy moving forward. After all, that’s the point of any financial calendar. It is not about the dates. But it is about the progress made between them.