Stock Option Value Calculator
Estimate vested options, intrinsic spread value, cash required to exercise, estimated tax holdback, ownership percentage, and net value under current FMV or a future exit price.
🎯Stock Option Scenario Presets
📝Option Grant Inputs
Used for formatting only; values are not exchange-rate converted.
Changes notes only; the intrinsic value math stays transparent.
Keeps granted, vested, and exercised options separate.
Vested options = total grant × vested percentage.
For private companies, use the latest 409A or planning FMV you trust.
Use fully diluted shares when estimating ownership percentage.
Optional planning holdback on taxable spread or scenario gain.
Discount private-company paper value for uncertainty or lack of liquidity.
📊Live Option Metrics
🧮Formula Breakdown
📋Option Type Reference Table
| Type | Value Input | Common Tax Trigger | Calculator Use | Planning Note |
|---|---|---|---|---|
| ISO stock option | Strike and FMV | AMT may apply on spread | Use current spread basis or custom tax rate | Tax timing can differ from cash sale timing |
| NSO stock option | Strike and FMV | Ordinary income on exercise spread | Holdback often uses current spread | Exercise may require cash for strike and taxes |
| Early exercise option | Strike, FMV, vesting | Depends on election and plan terms | Use vested percent and tax holdback carefully | Unvested shares can have repurchase terms |
| RSU comparison | Share value only | Often taxed at vesting | Set strike to 0 for a share-value view | Ownership and liquidity still matter |
| Secondary sale | Sale price scenario | Depends on gain character and timing | Use exit price and tax basis scenario | Company approval and transfer limits may apply |
| Expired or underwater | FMV below strike | No positive spread | Shows zero intrinsic spread | Future price can still create scenario value |
📆Vesting and Ownership Quick Table
| Grant Shape | Typical Vesting Input | Exercise Input | Ownership Input | Best Calculator Check |
|---|---|---|---|---|
| One-year cliff, four-year vest | 0% before cliff, then 25% | Usually all vested or custom | Fully diluted shares | Cash needed at first vesting event |
| Monthly vest after cliff | 25% plus monthly vesting | Percent of vested | Current fully diluted shares | Spread value as vesting increases |
| Refresh grant | Annual tranche percent | Custom number | Updated cap table | Separate old and new strike prices |
| Early exercise | May be 0% vested initially | Custom number | Post-exercise shares | Cash required even before vesting |
| Partially exercised grant | Use remaining vested options | Custom number | Fully diluted shares | Avoid counting exercised shares twice |
| Exit planning | Expected vested percent at exit | All vested | Future diluted shares if known | Scenario net after strike and holdback |
🔍Scenario Comparison Grid
| Scenario | Price Per Share | Spread Value | Exercise Cost | Tax Holdback | Net After Holdback | Ownership |
|---|---|---|---|---|---|---|
| Current FMV | $0 | $0 | $0 | $0 | $0 | 0% |
📘Common Planning Values
| Input | Low Planning Case | Middle Planning Case | High Planning Case | How To Use It |
|---|---|---|---|---|
| Estimated tax holdback | 0% to 20% | 25% to 40% | 45% to 55%+ | Run a range before exercising |
| Liquidity discount | 0% to 10% | 20% to 40% | 50% to 80% | Discount private paper value |
| Exercise share | 25% of vested | 50% to 100% | All vested plus early exercise | Match cash risk to conviction |
| Fully diluted ownership | 0.01% to 0.05% | 0.10% to 0.50% | 1%+ | Compare role level and dilution |
| Exit price sensitivity | Current FMV | 2x to 3x FMV | 5x+ FMV | Test upside before taxes |
| Strike spread | At or below zero | FMV 2x to 5x strike | FMV 10x+ strike | Shows option leverage |
💡Stock Option Value Tips
On the one hand, there is paper. On the other hand, you have your bank account. The root of employee equity tension is that these two never seem to line up.
That’s where our tool comes in. The calculator (above) will plug in numbers for you, so you don’t have to calculate coefficients or conversion factors. It takes your contract lingo and turns it into cold hard dollars and cents. But before you write that check, or even sign on the dotted line, you should of know what those numbers represent.
How to Understand Your Stock Options
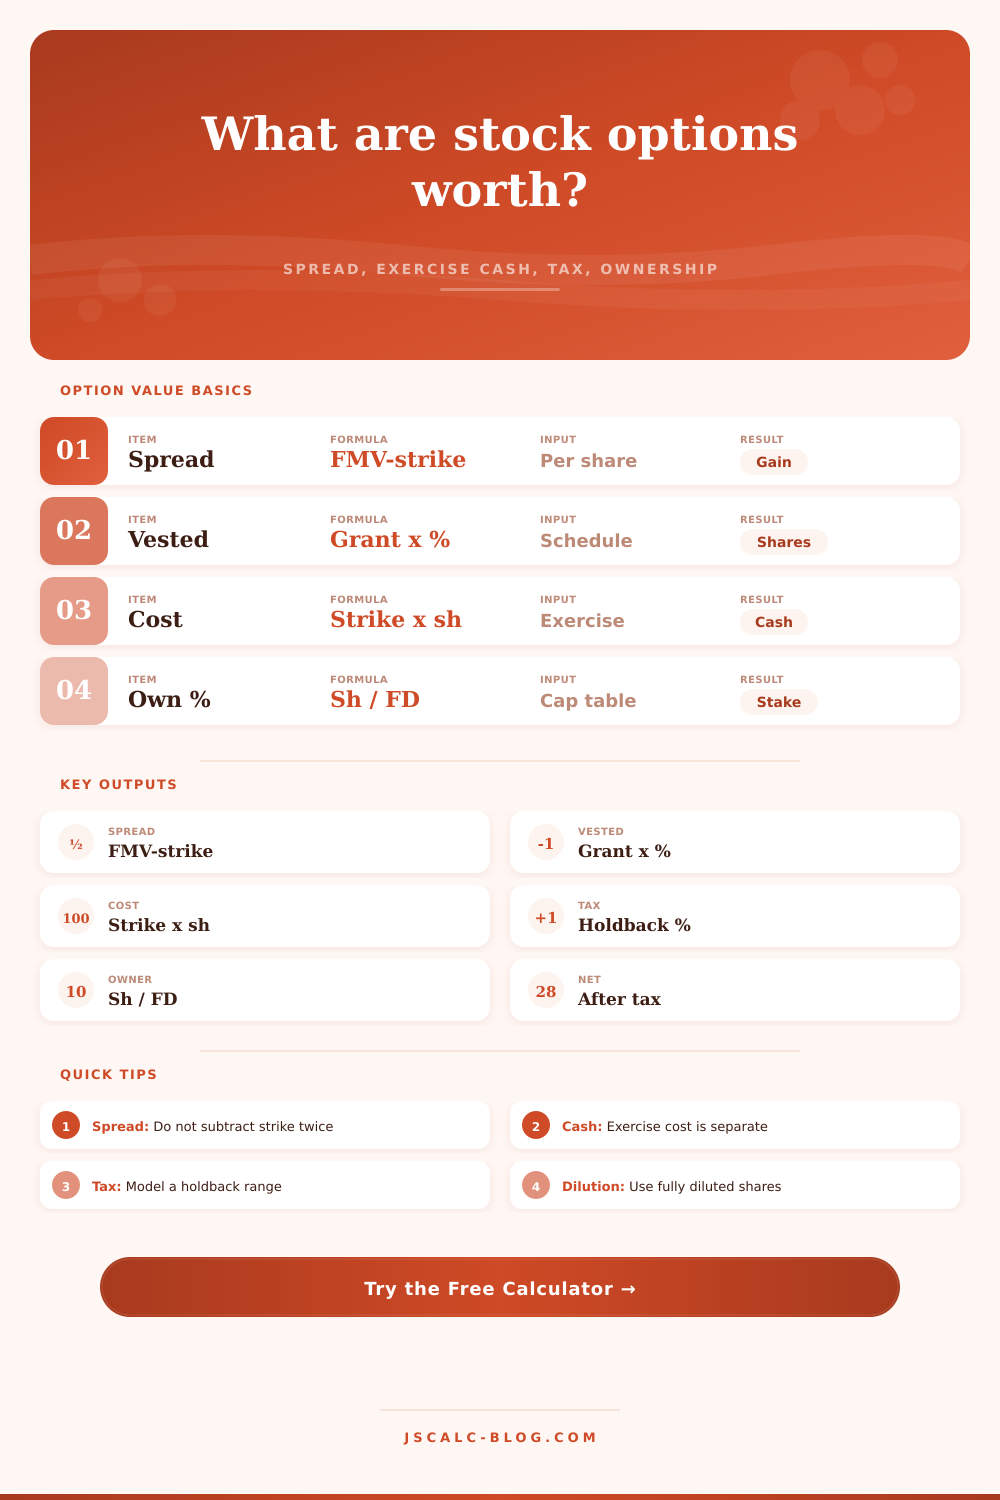
First of all, you have to look at spread. The value of the stock today minus the amount you paid for it. So if you purchased it for a buck and now it’s worth five bucks, then you made a spread of four bucks. That’s your gain, and that’s the amount you’re going to be taxed for. Most employees don’t realize when they recieve their stock that the cost to acquire the shares is strike price. So the spread is different than this.
Holding the shares equals profit (the spread). Those are two separate bucket. To purchase the shares you need cash; to pay taxes on the spread you need additional cash. The tool makes this clear so that you aren’t double counting.
So that’s where we get into “you don’t own anything” part of owning stock. The only thing you really do own is percentage that’s vested. Everything else is a promise. It’s a good promise, sure, but it’s a promise nonetheless. So put in your vested percentage. That will show you the amount you currently own. If you haven’t reached the cliff yet, then its zero. This is why folks stay around, but it’s also why your cash out depends on time. What you can sell depends on what you have. How fast you can move depends on what’s vested.
Where it gets tricky is in the tax holdback field, since exercising results in taxable income. You either have to wire them money or they’ll withhold shares to cover it. The calculator allows you to model a range of holdbacks. You can run it at fifty percent and then run it at thirty percent. How much cash do you need on hand? It’s not an abstract number. That is the money you need to exercise your options, and unless you have enough to cover the tax bill, the option isn’t worth anything. Valuation be damned; you need cash to get value.
You’re dividing your number of shares by the fully diluted cap table, which has a huge denominator: the reserves, plus all those other employees, plus investors. You don’t feel like an owner; of course you don’t! It’s just a thin slice. But that’s normal. Don’t get scared off by your percentage. Instead, look at the dollar value and look at the upside. A small slice of a huge pie can be better than a large slice of a crumb. The tool shows you how much you own, and helps you put your thin slice in perspective.
Then think about exit scenario (i.e., the price at which the company sells). The difference between your high case and your low case is enormous, but unknown. The fact is, private companies don’t always sell on schedule; they only sell when they’re good and ready, or they don’t sell at all. That’s where a price reduction for hard-to-sell assets grounds things, since it recognizes that having paper wealth isn’t the same as having cash. Maybe it’ll never be cash, so you should apply a discount for risk. This makes you both realistic and humble.
ISOs have different tax rules. It is laid out on the page in the reference table, for each type of option. NSOs are easier, though it gets complicated with early exercise. Because the type matters, you should know what you hold. The math is a little bit different, depending on type. And the tax timing is different. One size doesn’t fit all. Risk changes, the tax timing changes, and you need to match the inputs to your grant letter. Misunderstanding the type means that you get surprised later. Those surprises are usually bills.
The FMV is an estimate. The exit price is a guess and the tax rate is a prediction. Everything changes; all those inputs change, which changes your value. This isn’t a crystal ball. It’s a snapshot in time, capturing the moment, not predicting the future. That means you should update it and re-run the numbers whenever something changes. Your life changes, your vesting schedule changes, the market changes.
It’s all about leverage, because when you take action you invest time which has the potential of buying you upside. You accept risk, and the calculator tells you how much. It tells you the reward, and it tells the gap. How do you bridge that gap? With cash. And how do you bridge that gap? With patience. Don’t mix up the two; one buys shares while the other waits for value. Both are needed, but neither by itself is sufficient.
You’ve got options on paper, so you’d better have a plan for the rest.