Quick Ratio Calculator
Measure acid-test liquidity from cash, marketable securities, accounts receivable, and current liabilities while separately comparing current ratio and the target funding gap.
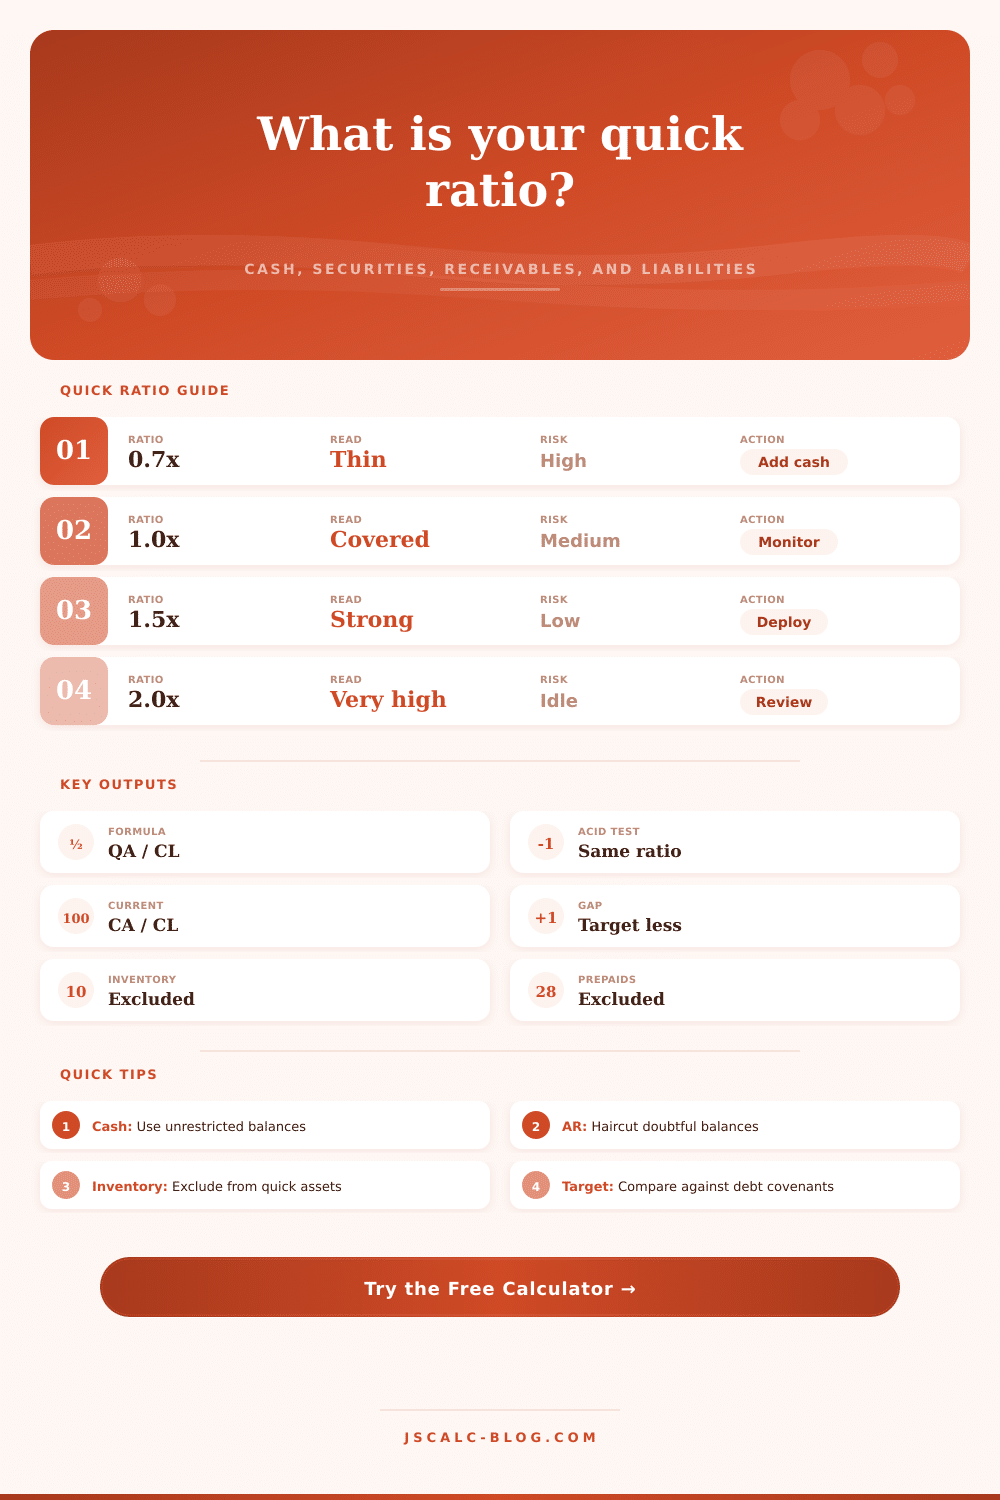
| Quick ratio range | Liquidity read | Typical signal | Useful next check |
|---|---|---|---|
| Below 0.75x | Thin | Quick assets do not cover most near-term liabilities. | Review cash runway, supplier terms, credit line, and AR aging. |
| 0.75x to 1.00x | Tight but workable | Coverage depends on fast collections and stable payables. | Stress receivables and upcoming maturities. |
| 1.00x to 1.50x | Generally covered | Quick assets cover current liabilities without relying on inventory. | Compare with industry norms and covenant thresholds. |
| Above 1.50x | Strong or conservative | Large liquid cushion may reduce short-term risk. | Check if cash is restricted or underused. |
| Balance sheet item | Quick ratio treatment | Current ratio treatment | Why it matters |
|---|---|---|---|
| Cash and cash equivalents | Included | Included | Most direct source for paying current liabilities. |
| Marketable securities | Included | Included | Liquid investments may convert to cash quickly. |
| Accounts receivable | Included after haircut | Included | Collectability and aging can change the real cushion. |
| Inventory | Excluded | Included | May take time to sell and convert to cash. |
| Prepaid expenses | Excluded | Included | Useful services, but usually not bill-paying liquidity. |
| Other current assets | Excluded by default | Included | Classification varies, so inspect before treating as quick. |
| Metric | Formula | Includes | Use |
|---|---|---|---|
| Quick ratio | (Cash + marketable securities + AR) / current liabilities | Only quick assets | Tests immediate liquidity without inventory. |
| Acid-test ratio | Same as quick ratio | Cash, securities, AR | Alternate name for the same calculation. |
| Current ratio | Current assets / current liabilities | Quick assets plus inventory, prepaids, other current assets | Broader working-capital view. |
| Target gap | Target ratio x liabilities - quick assets | Positive shortfall only | Shows cash or collections needed to reach the target. |
| Context | Common pressure | Inventory effect | AR check |
|---|---|---|---|
| Software or services | Deferred revenue and payroll timing | Usually low | Review enterprise invoice concentration. |
| Retail or ecommerce | Seasonal stock and payables | Often high | Less AR, more payment processor timing. |
| Manufacturing | Raw materials, WIP, and supplier terms | High | Match AR days against payable days. |
| Wholesale distribution | Large inventory funded by AP | Very high | Watch customer aging and rebates receivable. |
| Healthcare services | Payer collections and payroll | Low | Separate current AR from slow claims. |
| Construction | Retainage and project timing | Usually low | Split billed AR from retainage. |
You can have a current ratio that looks great on paper but still run out of money next Tuesday. That’s the trap. Most people look at their total current assets divided by their current liabilities and they think they’re good. “Oh I’m 2.0x covered,” they say. “I’m good.” But then when half of those assets is just sitting around in a warehouse as slow moving inventory, you can’t pay your payroll with a pallet of unsold goods.
The quick ratio takes away that illusion. It makes you focus only on what you can actualy spend today. Simple enough: Cash + Marketable Securities + Money Owing Customers = Stack. Divided by Stuff Owed in Next Twelve Months = Number. Everything Else = Ignore Pile. Inventory stays out. Prepaid insurance stays Out. That Other Miscellaneous Current Asset Category stays Out.
Why the Quick Ratio Matters
Why? Liquidity timing. Sure, maybe, someday you can sell inventory, but “someday” doesn’t help you when Vendor sends a dunning notice. A strict numerator, this is what makes it a liquidity test as opposed to a solvency test.)
Here is a good example. Say there’s a manufacturing company with a healthy current ratio because they are sitting on months of raw materials in stock. That’s an asset listed on its balance sheet. In reality, however, it’s a ticking time bomb if demand suddeny falls. Your quick ratio will shine a light on this hidden danger instantly. Run the math, and difference between your quick ratio and your current ratio reflects how dependent your business is based off things difficult to liquidate for fast cash. Typically, a wide gap signals a weak business model dependent on continuous inventory churn.
People overlook that aspect. They look at top line, the total amount of your assets, instead of how good those assets actualy are. You can see how this works. Apply a haircut to your accounts receivable with the tool above. Why? Because not all invoices is created equal. For example, thirty percent of your outstanding invoices might be from customers who have been paying late for six months. Counting those at full face value is optimistic accounting. Apply a discount to those receivables and you’ll get a more honest picture of your true liquidity. It is a more honest picture that keeps you from overestimating your cushion. Always calculate with a degree of skepticism about what you’re owed.
The pressure on this metric varies by industry. For example, a software company may have a lot of accounts receivables because it sells to big enterprise customers and minimal inventory. A retail store may have lots of inventory but fast cash turnover. Comparing the number to an industry benchmark provides context. A quick ratio of 1.5 may seem great for a restaurant with tight cash flows or bad for a SaaS business with low overhead. It’s not apples to oranges, and that’s where the context clues in reference tables on the page come into play.
Holding excess cash can also be psychologically taxing: “Maybe I’m being too conservative,” you may wonder when your quick ratio climbs over 2.0. Excess cash ties up capital that could of otherwise been used, whether to pay off expensive debt, fund R&D, or fuel growth. Target gap tells you whether you’re sitting on too much and should use it differently. It determines the incremental cash needed to reach some predefined level of safety, or whatever covenant requirement you’re concerned about. It translates an abstract ratio into a concrete number in dollars that you can either work toward…or against.
The bottom line: The quick ratio is a stress test of your working capital. If your sales suddenly stop cold, will you be able to pay your short-term obligations without defaulting? Can you do it without the comfort blanket of prepaids and inventory? Once you know how much you have compared to what you can spend, you begin managing your cash flow with more accuraccy. You abandon reliance on assets that may look nice in a spreadsheet but do nothing to help you out in an emergency. There is something worth more than just one number on your balance sheet: a shift in perspective.