Cash Conversion Cycle Calculator
Calculate the cash conversion cycle from average inventory, COGS, accounts receivable, credit sales, accounts payable, purchases or COGS, and reporting days. The tool also shows daily cash tied in operations, target gap, and the inventory, collections, and supplier-payment levers behind the result.
🎯CCC Presets
🧮Working Capital Inputs
Use one currency for every balance and flow input.
Enter 30 or 31 for a month, 90 or 91 for a quarter, or 365 for a year.
Usually beginning inventory plus ending inventory, divided by 2.
DIO uses average inventory divided by COGS, multiplied by days.
Use average AR for the same period as credit sales.
DSO should exclude cash sales that never create receivables.
Use average AP tied to inventory, materials, and supplier purchases.
If purchases are not known, choose COGS as the DPO denominator below.
DPO = average AP / purchases or COGS x days.
The gap estimates cash tied above or below this target.
Used to estimate finance drag from cash tied above target.
Used only for the interpretation note and comparison band.
📊Working Capital Snapshot
📐Formula Breakdown
📋CCC Comparison Grid
| Operating profile | Typical CCC range | DIO pattern | DSO pattern | DPO pattern | Working-capital signal |
|---|---|---|---|---|---|
| Negative CCC model | Below 0 days | Fast or pre-sold inventory | Cash or prepaid sales | Longer supplier terms | Supplier float helps fund operations |
| Grocery or quick-turn stock | 0 to 20 days | Very fast inventory movement | Mostly cash or card sales | Moderate supplier terms | Cash conversion is usually strong |
| Retail and consumer goods | 20 to 55 days | Seasonal stock drives DIO | Low to moderate AR | Terms partly offset inventory | Watch inventory build before peaks |
| Wholesale distribution | 35 to 75 days | Broad SKU catalog | Trade credit common | Supplier terms meaningful | Margins depend on turn discipline |
| Manufacturing | 45 to 100 days | Raw material plus WIP | B2B invoice collection | Material supplier terms | Cycle can stretch during build phases |
| Construction materials | 55 to 120 days | Project-linked stocking | Progress billing delays | Vendor terms vary by trade | Job timing can dominate the metric |
| Stressed working capital | 100+ days | Slow-moving inventory | Late collections | Short supplier terms | Cash may be locked in operations |
🗂Input Source Table
| Input | Best source | Period matching rule | Common mistake |
|---|---|---|---|
| Average inventory | Balance sheet inventory | Use beginning plus ending inventory / 2 | Using only year-end inventory during seasonal peaks |
| COGS | Income statement | Use COGS for the same days as inventory average | Mixing quarterly inventory with annual COGS |
| Average AR | Accounts receivable ledger | Use the same customer sales period | Including cash sales in the DSO denominator |
| Credit sales | Sales report by payment type | Exclude cash, card, and prepaid sales when they do not create AR | Using gross revenue when most sales are immediate cash |
| Average AP | Accounts payable ledger | Use supplier AP tied to operating purchases | Including taxes, payroll, or financing payables |
| Purchases | Purchase ledger or inventory rollforward | Prefer purchases for DPO when available | Using COGS when purchases changed sharply |
🔁Cycle Lever Table
| Lever | Formula effect | Cash movement | Review metric | Watch-out |
|---|---|---|---|---|
| Lower DIO | Reduces CCC | Inventory cash released sooner | Inventory turns and aged stock | Too little stock can hurt fulfillment |
| Lower DSO | Reduces CCC | Receivables convert faster | Aging buckets and dispute rate | Overly strict credit can slow sales |
| Higher DPO | Reduces CCC | Supplier cash stays longer | Payment terms and early-pay discounts | Late payment can damage supply |
| Higher gross margin | Changes daily COGS lens | Less COGS cash needed per sales dollar | Gross margin and contribution margin | CCC days still use operational balances |
| Better forecasting | Mainly lowers DIO | Prevents excess stock build | Forecast error and stockout rate | Forecast bias can hide slow movers |
| Cleaner billing | Mainly lowers DSO | Invoices start collection sooner | Days to invoice and first-pass approval | Unresolved disputes inflate AR |
📆Period Day Quick Lookup
| Reporting period | Days to enter | Best use | Balance averaging note |
|---|---|---|---|
| Monthly close | 28 to 31 | Fast operational review | Average beginning and ending month balances |
| Fiscal quarter | 90 or 91 | Standard management reporting | Works well for seasonal inventory and AR swings |
| Year to date | Actual elapsed days | Midyear trend check | Keep flow values year-to-date too |
| Annual period | 365 or 366 | Investor or lender analysis | Average balances may need more than two points |
| Custom project cycle | Exact project days | Project-based businesses | Match inventory, AR, AP, and flows to project dates |
💡CCC Calculation Tips
It’s possible to make money, but nevertheless go broke. How? Because while “profit” is an accounting concept, “cash” is physical reality. There’s an operational stress between making a dollar and seeing it sitting in your bank account.
That’s why the cash conversion cycle is important, it tells us how much time elapses between when you spend money buying inventory vs. Collecting money from customers. The longer this time-lag, the more you’re using your own working capital to fund your suppliers.
Why Cash Flow Is More Important Than Profit
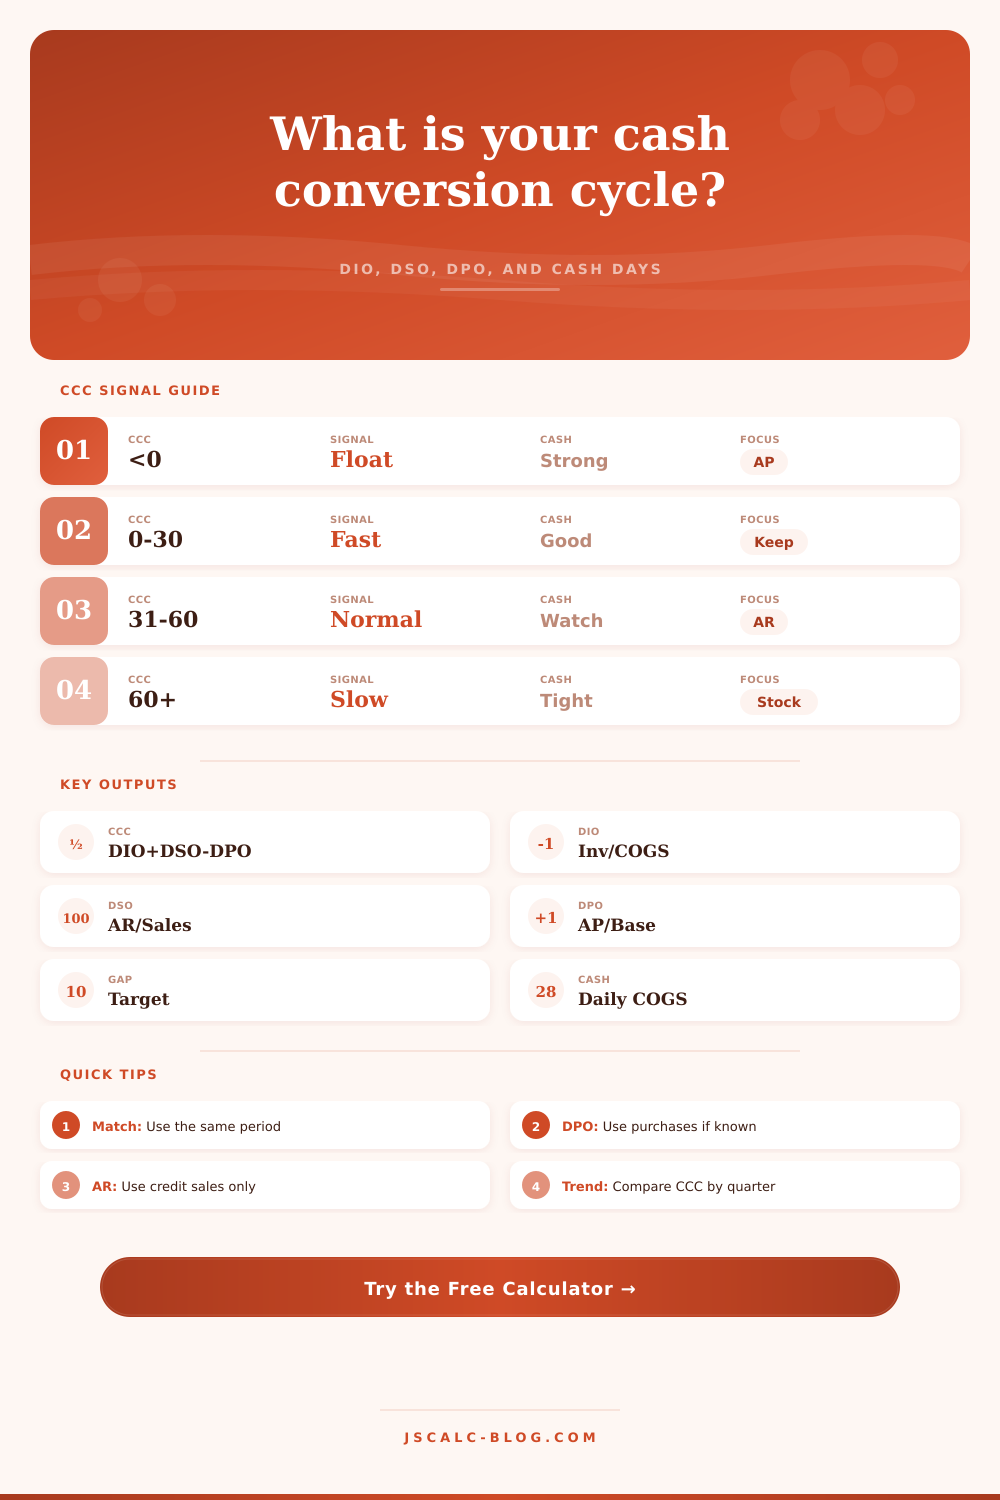
You plug in your income statement flows, balance sheet averages and let the calculator do the math. And it breaks the cycle down into three part: How many days does inventory sits on the shelf before being sold? (Days inventory outstanding.) How many days does it take to get paid for the invoice? (Days sales outstanding.) How many days do you hold onto cash before paying vendor? This is the number of days your payables are outstanding.
What’s the net result? Are your operations consuming cash or generating cash?
The second reason most folks gets it wrong is that they mix their inputs. They compare annual cost of goods sold with a year-end inventory snapshot. Those two numbers can’t be in the same universe. If you’re looking at a quarter, then the averages should be for that quarter as well. The tool on the page forces you to define the reporting period upfront. This keeps you disciplined and prevents you from comparing apples to oranges in your financial analysis.
The largest drag on the cycle typically lies in inventory. Storing money that doesn’t move around is an expensive way to warehouse it. Reducing days inventory held put cash back into the business. That’s not necessarily a matter of carrying less stock. It’s a matter of turning over whatever stock you’re holding more efficient.
Naturaly, retailers with fast-moving goods will have better cycles than, say, manufacturers who face complex production lead times. You can see these patterns by industry pretty clearly on the reference table in the tool.
The second lever is collections. When you take 60 days to collect from your customers and then pay your suppliers at 30-days, you’ve created a cash hole. You’re financing the sale. One way to tighten this up is to squeeze credit terms. But you’ll also typically hurt your sales volume. Every sales person knows there’s a tradeoff here. The trick is to find the right balance between collecting faster while not alienating the customer. With the calculator, you can play with different target cycle days to see what works for you.
Other ways to improve the cycle include paying vendors later. Sounds nice in theory. Comes with risk. When you stretch your terms, the vendor will know about it. If there’s a chance that they don’t get paid, they may require a deposit. Or they may tighten up their credit themselves. Why?
You should of compared your results against industry benchmarks as a way to evaluate risk and context. You want to make sure you’re comparing your numbers with industry benchmarks. A negative cash conversion cycle looks great on paper. You’re getting paid before you have to pay! (Amazon is famous for doing this.) But for the small distributor, a negative cycle could simply be a sign that they lack liquidity and are being forced to delay payments. Always keep context in mind.
Second: The tool also includes the finance drag of the delays you put in play. That’s right: When you delay production by thirty days and tie up a half-million bucks in inventory as a result, that ain’t free money. That’s money that could have been used to pay down debt or earn interest at eleven percent per year. Those delays compound fast. And while this isn’t much it goes a long way toward your long-term solvency.
The bottom line: Managing your cash conversion cycle is all about speed. Faster turns mean more opportunities to reinvest. Slower turnover means more risk. You don’t have to have perfect data to identify a trend. Consistent inputs are enough. Over time, watch the cycle. If it’s growing, find out why. Is inventory piling up? Are customers paying late? The numbers will tell you. And then you can act before the cash runs out. Keep the cycle tight to keep the business healthy.