Inventory Turnover Calculator
Calculate inventory turns from COGS and average inventory, or estimate COGS from sales and gross margin. Add shrinkage, compare target turns, and translate turnover into days inventory outstanding.
📌Inventory presets
🧮Turnover inputs
Use actual COGS when available; sales mode is a planning proxy.
Needed for sales-to-COGS mode and sales coverage checks.
COGS percentage equals 100% minus gross margin.
Use positive for write-downs or freight-in, negative for corrections.
Inventory turnover results
📊Current scenario summary
🗂Industry comparison grid
| Inventory profile | Typical turns | Typical DIO | Risk when below range | Risk when above range |
|---|---|---|---|---|
| Grocery and consumables | 12x to 24x | 15 to 30 days | Spoilage or weak buying discipline | Stockouts on staple items |
| Restaurant and food service | 18x to 36x | 10 to 20 days | Waste, dead prep, oversized orders | Menu shortages and rush buying |
| Pharmacy and health retail | 8x to 14x | 26 to 46 days | Expiry exposure and slow movers | Service misses on critical SKUs |
| Apparel and seasonal retail | 3x to 6x | 61 to 122 days | Markdown pressure and season risk | Missed sizes or shallow assortment |
| Electronics and appliances | 4x to 8x | 46 to 91 days | Obsolescence and model change risk | Backorders on popular models |
| Wholesale distribution | 5x to 10x | 37 to 73 days | Warehouse congestion and carrying load | Lower fill rate for customers |
| Manufacturing work-in-process | 4x to 9x | 41 to 91 days | Long cycle time and trapped cash | Line stoppage from thin buffers |
| Maintenance and spare parts | 1x to 4x | 91 to 365 days | Obsolete spares and excess bins | Equipment downtime risk |
🔢Formula and method breakdown
| Step | Formula | What it means | Use in this calculator |
|---|---|---|---|
| Average inventory | (Beginning inventory + Ending inventory) / 2 | The average stock investment held during the period. | Denominator for turnover and target planning. |
| Inventory turnover | COGS / Average inventory | How many times inventory is sold through and replaced. | Main result card, always based on adjusted COGS. |
| Sales/COGS method | Sales x (1 - Gross margin %) | Estimates COGS when a P&L COGS number is not ready. | Optional method selector in the form. |
| Shrinkage add-back | Average inventory x Shrinkage % | Inventory losses that still consume the stock base. | Added to COGS for operating turnover. |
| DIO | Days in period / Inventory turnover | Approximate days inventory sits before sale. | Second result card and comparison rows. |
| Target average inventory | Adjusted COGS / Target turns | Average stock required to hit the selected target. | Gap card and target planning table. |
🧭Target turns planning table
| Target turns | Target DIO | Average inventory needed | Gap versus current | Interpretation |
|---|---|---|---|---|
| Calculate to build the target table. | ||||
🔍Method comparison table
| Method | COGS basis | Turnover | DIO | Best use |
|---|---|---|---|---|
| Calculate to compare actual COGS, sales-estimated COGS, and shrink-adjusted COGS. | ||||
🚦Shrinkage sensitivity table
| Shrinkage rate | Shrinkage value | Adjusted COGS | Turnover | DIO |
|---|---|---|---|---|
| Calculate to see how shrinkage changes operating turnover. | ||||
💡Inventory turnover tips
You’ve got lots of stuff in storage (but no money in the bank). Operations managers knows that feeling. On one hand, you’re sitting on an asset. But on the other hand, it’s sitting there, it’s eating up money in the form of holding fees, insurance, and maybe even spoiling.
Inventory turnover are a measure of how efficient your supply chain operates. It’s also a measure of how fast you turn inventory into sales.
How to Calculate Inventory Turnover
With help of calculator, you’ll see exactly how efficient your supply chain is (or isn’t). Your average inventory level vs. Your cost of goods sold will tell you how many days worth of inventory you have, or if you feel like something are cluttering up your operation, it’ll give you a number to work with.
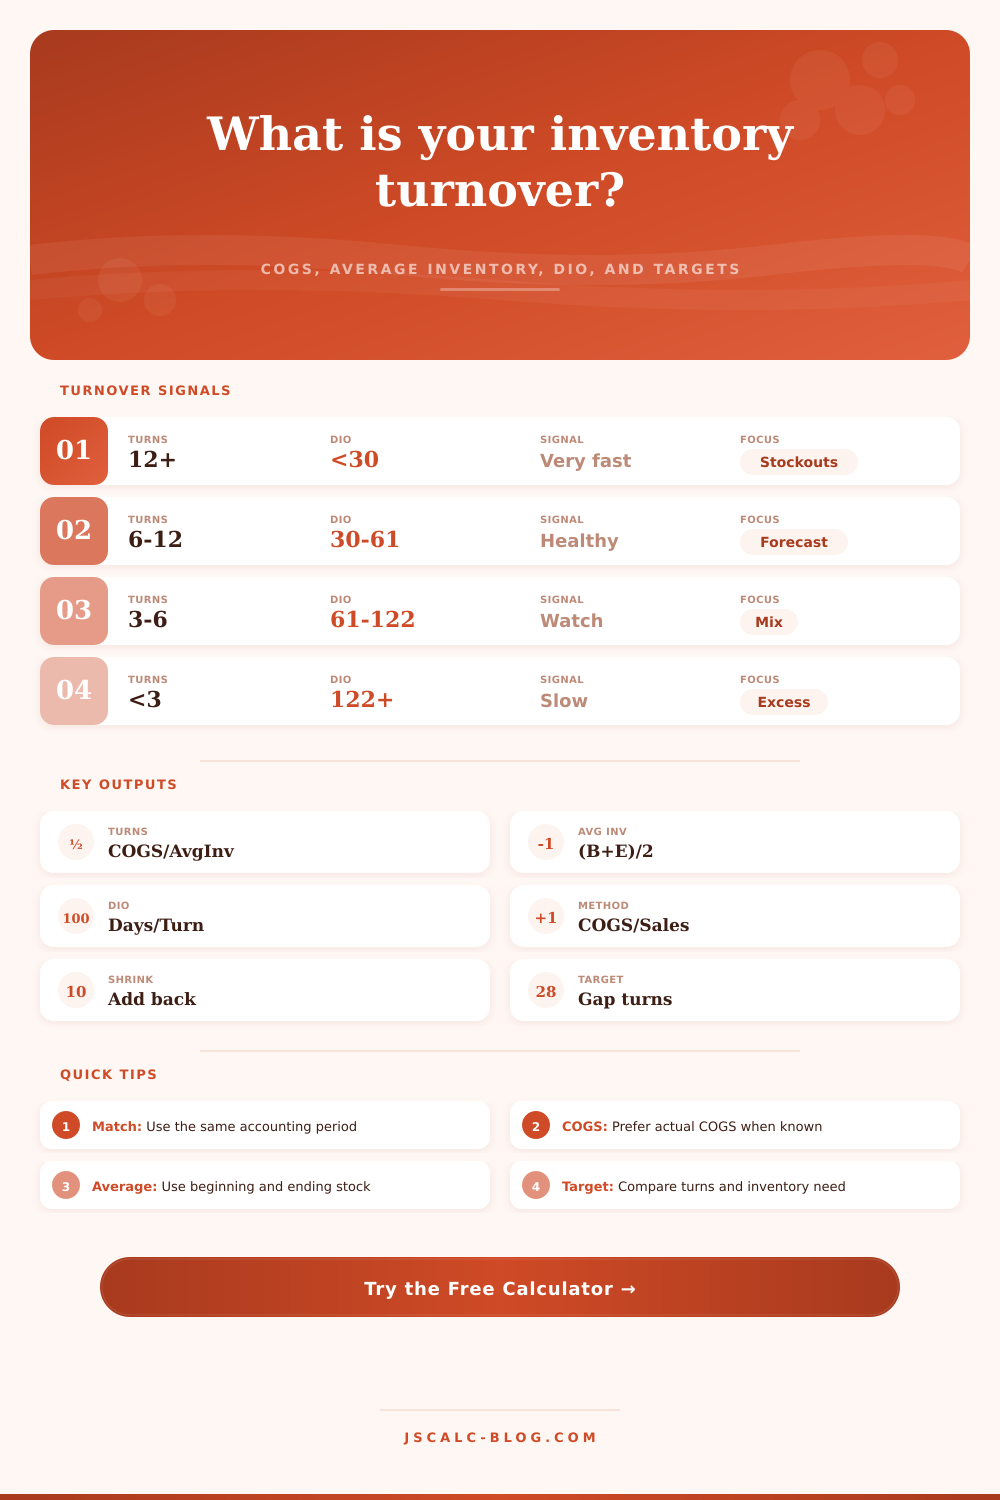
The first place most people look is at the ratio itself. Here’s how to calculate it: Take your cost of goods sold for some time period, then divide it by your average inventory over the same time period. Your answer is your turnover rate.
If you have a large number, chances are you’re moving product quick. If you have a small number, you’re sitting on capital that’s not doing anything for you.
When attempting to define average inventory, the math gets difficult. Just using the ending balance can be misleading because it fail to account for changes throughout the month or year. To remedy this, you can enter beginning and ending balances into the tool which will give you a true average. This slight adjustment avoids seasonal spikes that could distort your understanding of how business is doing.
And then there’s shrinkage. Shrinkage mean loss due to admin error, theft or damage. These losses do not create revenue but reduces your total inventory. If you’re not accounting for this shrinkage, your turnover ratio will appear abnormally good. You’ll be dividing by an inventory amount that’s less than what you’ve invested.
The calculator allows you to put shrinkage back into your cost of goods sold. This helps you get a truer view of how well (or poorly) things is running. It provides a better split between how fast you sell something versus how leaky your storage are. That is the difference between fixing the financial drag at its roots versus just speeding up the flow.
Days Inventory Outstanding is another one to examine. It’s the turnover ratio expressed in days, or the answer to: How many days does each unit spend on the shelf? If your turnover is six times per year, that’s sixty days.
Sixty days seems reasonable, until you consider that for some categories (electronics especially), sixty days are a recipe for disaster. Tech becomes outdated rapid. In fashion, it’s seasonal. Food goes bad. What works in one industry won’t work in another.
The table on the page gives an idea of what’s normal for various industries. Grocery retailers must have turnovers of more than twelve to stay afloat. Spare parts dealer may be able to get away with three. Having a sense for where your industry starts keeps you from setting an inappropriate bar for your business model.
The last piece of this puzzle is setting a target turnover. That’s where you figure out your goal for inventory level given the rate at which you want it to turn over. Next, you look at your average and then see the difference between the two. This difference represent the amount of cash you should of freed up if you tighten your ordering process.
Perhaps you negotiate improved lead times from suppliers. Perhaps you stop stocking slow moving SKUs.
The math is straightforward, but the follow through demand discipline. To execute here, you’ll need to let some products go. Trust the numbers instead of following your gut.
It’s all about balance. If you don’t have enough stock, you’ll run out. You’ll lose sales. If you have too much stock, you’ll tie up your capital. You’ll increase your risk. You want to be right in the middle where your inventory matches demand and the cash starts flowing smoothly.
And that’s where the calculator comes in. It gives you the numbers to help you manage that balance. It takes the guessing game out of the planning meeting. No more debates over whether you’re running out of product or you’ve got too much on hand. Now it’s a debate over how to narrow the gap. And that’s a far more productive discussion.
It turns your messy warehouse into a lean machine, and that’s exactly why you measure turnover in the first place.