Accounts Payable Turnover Calculator
Calculate AP turnover, average accounts payable, and days payable outstanding using either net credit purchases or the COGS proxy.
⚡AP turnover presets
📝Inputs
Purchases is best when AP relates mainly to supplier credit purchases.
Profile changes the benchmark band and interpretation text.
Purchases before cash exclusions, returns, and purchase allowances.
Use only if these items are in AP and should stay in purchase flow.
Positive means inventory rose; negative means inventory fell.
AP turnover results
📊Method snapshot
🗂Purchases method vs COGS proxy comparison grid
| Method | Denominator | Turnover | DPO | Best use |
|---|---|---|---|---|
| Net credit purchases | $0 | 0.00x | 0.0 days | Supplier-credit AP analysis |
| COGS proxy | $0 | 0.00x | 0.0 days | Fast estimate when purchases are unavailable |
| COGS adjusted by inventory change | $0 | 0.00x | 0.0 days | Inventory-heavy trend check |
📑Operating profile reference table
| Profile | Typical DPO band | Turnover lens | Common distortion | Review cadence |
|---|---|---|---|---|
| Manufacturing inventory | 35 to 60 days | COGS and purchases | Inventory builds | Monthly close |
| Wholesale distribution | 30 to 55 days | Net supplier purchases | Seasonal buys | Weekly AP run |
| Retail and ecommerce | 20 to 45 days | Inventory purchases | Cash marketplace fees | Weekly trend |
| Restaurant and food | 10 to 30 days | Food and beverage buys | COD vendors | Weekly close |
| Construction trade payables | 35 to 75 days | Job supplier AP | Retainage and holds | By project |
| Services and SaaS vendors | 25 to 50 days | Vendor spend | Annual prepaids | Monthly close |
| Healthcare supplies | 30 to 60 days | Supply purchases | Contract pricing credits | Monthly close |
| Nonprofit operations | 25 to 55 days | Operating vendor AP | Grant timing | Board cycle |
📈Turnover and DPO signal table
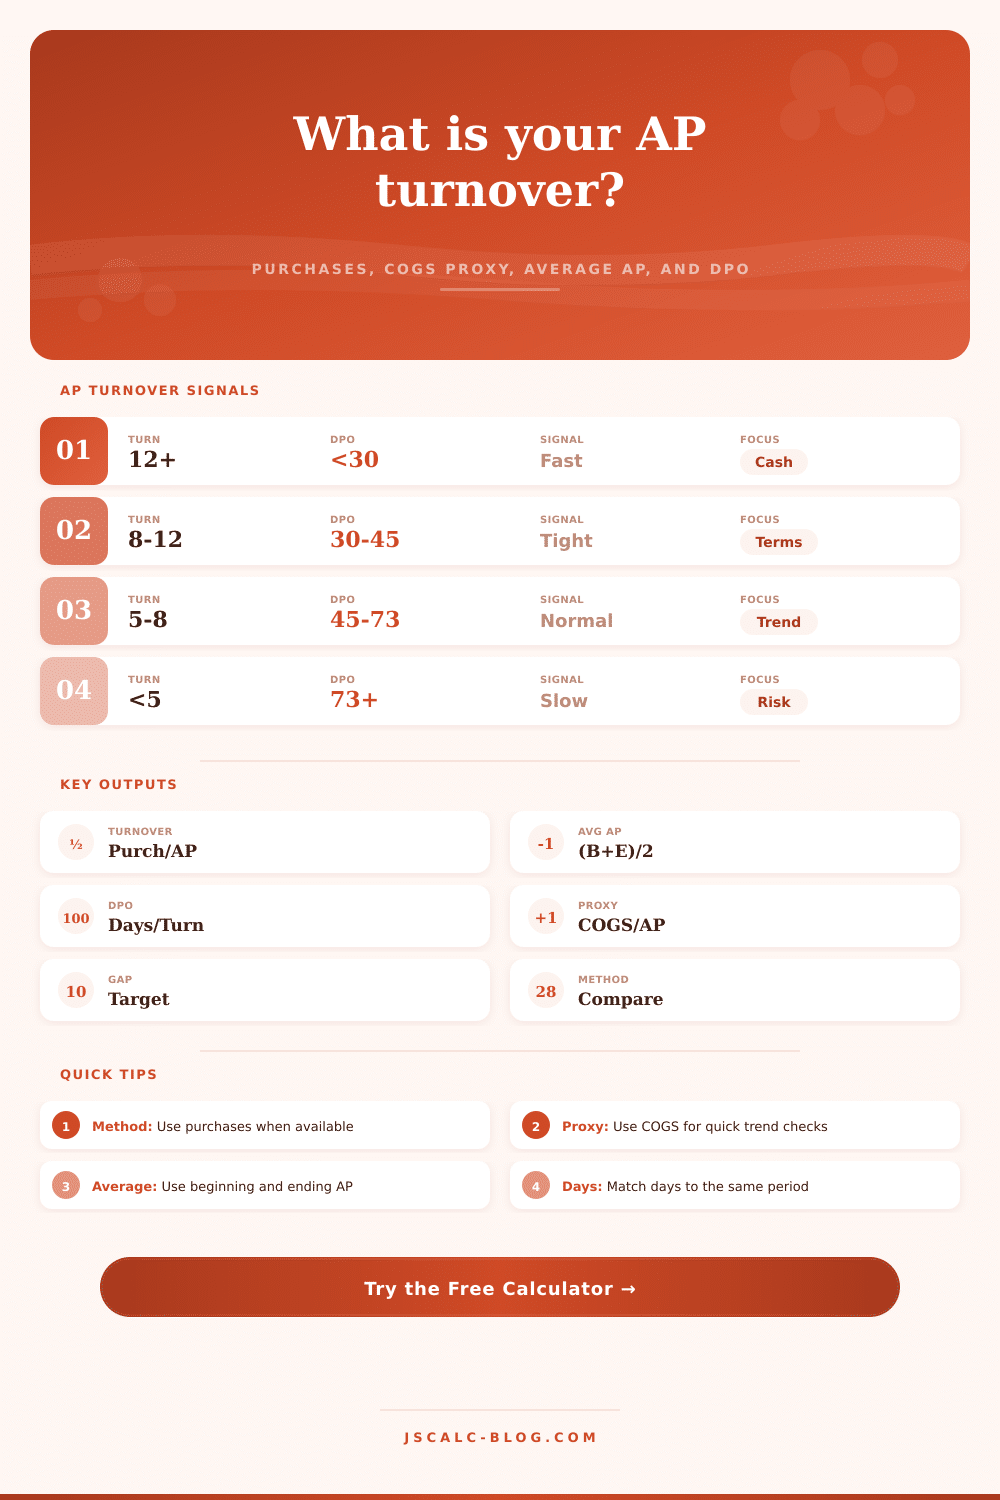
| Annualized AP turnover | Approx DPO | Signal | Working-capital read | Next check |
|---|---|---|---|---|
| 12.0x or higher | Under 30 days | Fast payment pace | May be missing supplier credit | Review terms capture |
| 8.0x to 12.0x | 30 to 45 days | Moderate pace | Common for short terms | Compare to due dates |
| 5.0x to 8.0x | 45 to 73 days | Extended but common | Useful cash cushion if current | Review aging buckets |
| 3.0x to 5.0x | 73 to 122 days | Slow payment pace | Could signal stretched AP | Check disputes and holds |
| Below 3.0x | Above 122 days | Very slow pace | Supplier pressure risk | Reconcile vendor balances |
🔢Formula and method table
| Line | Formula | Use when | Watch item |
|---|---|---|---|
| Average AP | (Beginning AP + Ending AP) / 2 | Balance sheet varies during the period | AP cutoff errors |
| Net credit purchases | Gross purchases - cash purchases - returns + addbacks | Purchase ledger is available | Cash buys mixed into AP |
| AP turnover | Net credit purchases or COGS / Average AP | Measuring vendor payment pace | Mismatch with AP scope |
| DPO | Period days / AP turnover | Translating turnover into days | Wrong period days |
| Inventory adjustment | COGS + inventory increase | Purchases are unavailable | Large inventory swings |
🧭AP review tips
Accounts payable is a strategic lever on your cash flow. It’s often seen as a nuisance, it is actualy a strategic lever that controls your cash flow. It is the amount you owe vendors. It’s one of those things that can tighten up your cash position more quicker than a drop in sales if you get it wrong. Most business owners will look at their balance sheet only once per quarter, that leaves money on the table and risks relationships with supplier.
That dynamic comes out in one metric called the accounts payable turnover ratio. This tells you how many times you’ve paid down suppliers over some time frame. The more often, the faster (and the more money you’re burning through), which reduces your cash reserves but keeps everyone happy. The less often, the more cash you’re holding, which boosts liquidity but may tick off suppliers if taken to far.
Why Accounts Payable Matters for Your Business Cash
Plug in your purchase info, and the calculator takes care of the rest for you. Decide whether you want to work with net credit purchases or use cost of goods sold as a stand-in here. If your books are squeaky-clean, go with purchases (it filters out only the credit portion). This is most accurate. Go with the COGS proxy if your purchase ledgers aren’t clear-cut; it’s a crude approximation, though, so it can get skewed depending on how much inventory you buy/sell. If your stock levels is soaring/dropping like crazy, this proxy will tell you that you’re paying too fast/ slow.
To get it right, you need to input the starting and ending accounts payable balances. You’ll then want to average both numbers to smooth over any volatility in your end-of-month cutoffs. That’s why you want to take into account a surge in invoice processing near the close, which can skew your number if you only consider ending number. Depending on when you are looking, your turnover will appear either artificially high or low.
The tool allows you to account for cash purchases, allowances and returns that shouldn’t factor into the credit analysis. For example, cash buys need to be stripped out since they don’t show up anywhere on the payable ledger. So including cash buys in the denominator skews the whole ratio by inflating it. This is where people tend to get it wrong. They assume all spends are created equal; but here, the only variable that matters is timing of payment.
After you run the tool, you’ll get your days payable outstanding. That’s the ratio expressed in a more concrete way: How many days does it take for you to pay off a bill? What is average? Look at that number against normal ranges for your industry. Because their supply chain is complicated, manufacturers typically has longer payment periods; retailers turn over more quickly. Does yours differ dramaticly from theirs? Vendors may begin asking for shorter terms. Or even upfront payment. Is it below theirs? It means you’re extending them an interest-free loan. Adjust the target DPO in the tool to understand how far you’ve strayed from your ideal. This usually comes down to tightening up internal approval processes or negotiating new terms.
These figures get some context from the signal tables they provide.
Fast: If the turnover rate is 12+ (i.e., if DPO is less than 30 days), then that’s speedy. It is good for relationships but bad for cash flow.
Slow: If the turnover rate is four or fewer, that means the DPO is greater than 73 days and you’re preserving cash … but straining suppliers.
That’s the trick, knowing what exactly you’re measuring here. It isn’t just payment timing. You’re measuring how well you’ve managed your working capital cycle. Each additional day that you keep someone else’s money in your pocket is one more day you could invest it somewhere else or pay off your higher-interest debt. But you don’t want to stretch out payables so far as to damage your reputation within those close supplier networks. Word gets around. Who pays their bills on time?
And then compare yourself to others with similar operating profiles using the reference data as benchmarks. If you run a restaurant don’t judge its AP like that of a manufacturer. It’s apples and oranges. Same for a SaaS vs. A wholesale distributor. The products, the supply chain, and the standards are all different.
Use it to measure your progress over time. Have your DPO crept higher? Is it good because you’re negotiating better deals, or is it bad because you’re having trouble making payments? The first is a strategic victory, while the second is a red flag.
Managing accounts payable is all about timing. To breathe easy as a business, you have to get your spending aligned with your income. The calculator provides that level of accuracy to help you do this on purpose, instead of by accident. Run through this at least monthly, not once a year. A small change in your DPO compounds over time and it has a huge impact on your bottom line. Pay attention to the signals, pick the right approach for your business model, and ensure your data is clean.
The idea isn’t to pay as fast (or slow) as you can. The idea is to pay just at the moment that it’s best for your cash flow, while not negatively impacting your supply chain. This balance keeps your money from slipping away.