Accounts Receivable Turnover Calculator
Measure how many times receivables are collected during a reporting period. Enter gross sales, cash sales exclusions, returns, write-offs, beginning AR, ending AR, days, and a target to calculate AR turnover, collection period, and the gap against policy.
🎯AR Turnover Presets
🧮Receivables And Credit Sales Inputs
Collection period equals days divided by turnover.
Used for the target comparison and interpretation.
Opening AR balance at the start of the period.
Closing AR balance at the end of the period.
Total period sales before cash and credit adjustments.
AR turnover uses credit sales, so immediate cash sales are removed.
Subtract credit memos and sales allowances from the sales base.
Used as a quality lens and optional credit-sales adjustment.
Many teams keep write-offs separate; choose the policy used in your report.
Use actual reporting days for the collection period.
Compare actual collection period with credit policy.
Auto-filled from target days unless you override it.
🔢Current Metrics Snapshot
📌Credit Policy Profile Grid
📐Formula Breakdown
📊Accounts Receivable Turnover Comparison Grid
| Scenario | Net Credit Sales | Average AR | Turnover | Collection Period | Target | Read |
|---|---|---|---|---|---|---|
| Fast B2B month | $310,000 | $24,500 | 12.65x | 2.4 days on 30-day period | Net 15 | Very fast within a monthly close |
| Standard SaaS quarter | $470,000 | $200,000 | 2.35x | 38.3 days on 90-day period | Net 30 | Slightly slower than strict terms |
| Manufacturer quarter | $1,393,000 | $675,000 | 2.06x | 44.1 days on 91-day period | Net 45 | Inside normal industrial terms |
| Wholesale season | $1,074,000 | $550,000 | 1.95x | 30.8 days on 60-day period | Seasonal | Good, but ending AR may spike |
| Clinic claims cycle | $499,000 | $287,500 | 1.74x | 51.9 days on 90-day period | Insurance | Reasonable if denials stay controlled |
| Construction progress bills | $2,010,000 | $980,000 | 2.05x | 58.5 days on 120-day period | Milestone | Watch approvals and retainage mix |
| Enterprise annual review | $9,635,000 | $1,330,000 | 7.24x | 50.4 days on 365-day period | Enterprise | Large approvals can stretch collection |
| Cleanup plan quarter | $647,000 | $307,500 | 2.10x | 42.8 days on 90-day period | Net 30 | Improving, still above target |
📋Turnover Signal Reference
| Annualized Turnover | Approx Days | Collection Signal | Working-Capital Read | Review Focus |
|---|---|---|---|---|
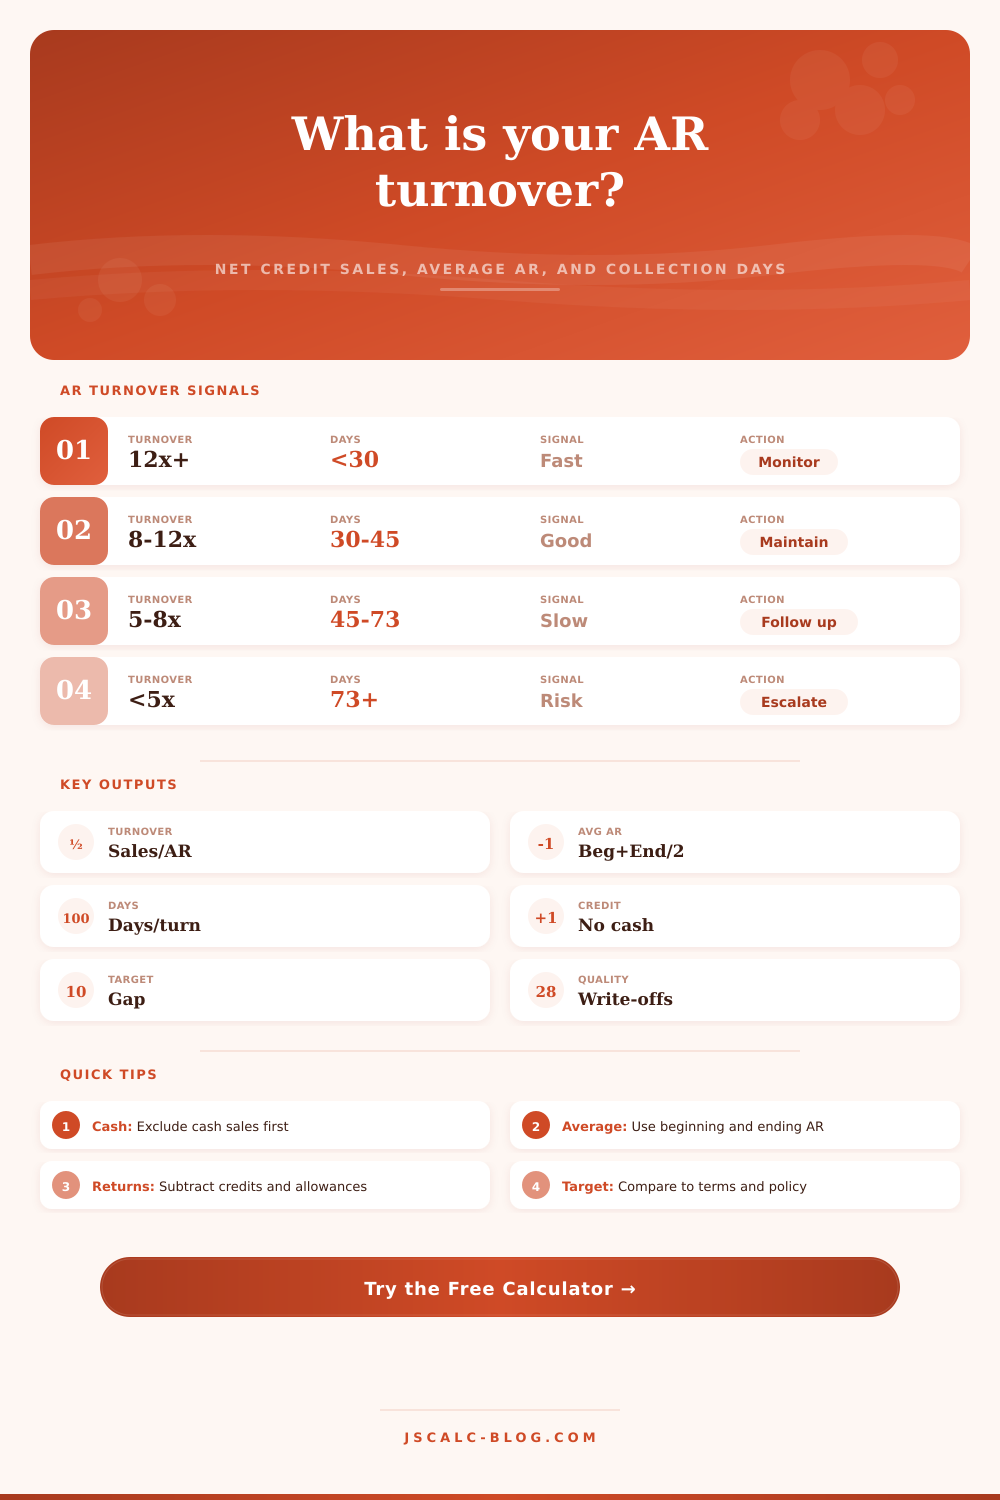
| 12x or higher | 30 days or less | Fast collection | Receivables convert quickly | Confirm terms are not too tight for key customers |
| 8x to 12x | 30 to 45 days | Healthy for many B2B teams | Typical net 30 to net 45 performance | Compare by customer segment and invoice size |
| 5x to 8x | 45 to 73 days | Collection pace slowing | More cash sits in open invoices | Past-due bucket, disputes, and approval routing |
| 3x to 5x | 73 to 122 days | Stressed receivables | Liquidity pressure may build | Customer-level collection plan |
| Below 3x | 122+ days | Severe delay or denominator issue | AR may be aging faster than sales | Write-offs, bad debt reserve, and billing cutoffs |
💳Credit Sales Adjustment Table
| Input Line | Included In Numerator? | Calculator Treatment | Why It Matters |
|---|---|---|---|
| Credit invoices | Yes | Kept in gross sales | Creates collectible receivables and supports turnover |
| Cash sales | No | Subtracted before turnover | Cash sales never enter accounts receivable |
| Returns and allowances | No | Subtracted from gross sales | Removes invoices or sales value no longer collectible |
| Credit memos | No | Enter with returns and allowances | Keeps the denominator tied to collectible sales |
| Write-offs | Policy-dependent | Quality lens or optional subtraction | Shows whether turnover is helped by removing bad AR |
| Finance charges | Usually separate | Exclude unless reported as sales | Can distort credit-sales turnover if mixed in |
🗓Period Day Quick Lookup
| Reporting View | Days To Enter | Best AR Balance | Useful Target | Watchpoint |
|---|---|---|---|---|
| Monthly close | 28 to 31 | Average AR if sales are uneven | Written terms plus grace days | End-of-month billing surges |
| Quarterly close | 90 or 91 | Beginning and ending AR | Quarter days divided by terms target | Large invoices near period end |
| Half-year review | 181 to 184 | Average AR or rolling monthly average | Policy target carried across two quarters | Seasonality and collection campaigns |
| Annual review | 365 or 366 | Average AR across fiscal year | 365 divided by target collection days | One-time write-offs and acquisitions |
| Custom cycle | Exact cycle days | Match AR to same cutoffs | Contractual billing cadence | Do not mix cash sales with credit invoices |
🎯Target Gap Interpretation
| Actual Vs Target | Turnover Meaning | Collection Period Meaning | Typical Next Metric |
|---|---|---|---|
| More than 10 days faster | Turnover is well above target | Collections are ahead of policy | Customer friction and credit hold rate |
| Within 5 days | Turnover is close to target | Normal working-capital load | Aging mix by invoice bucket |
| 6 to 15 days slower | Turnover is below target | Moderate collection drag | Top overdue customer concentration |
| 16 to 30 days slower | Turnover is materially weak | Cash conversion needs attention | Dispute rate and promise-to-pay accuracy |
| 30+ days slower | Turnover is far below target | Receivables may be stale | Write-off risk and collection escalation |
💡AR Turnover Calculation Tips
Accounts receivable turnover is a measure of your efficiency in turning credit sales into cash. It’s a health check on your business; it removes the noise to tell you how quickly you collect.
To run this, you need to carefuly prepare inputs. However, most folks is counting their gross sales number without differentiating between cash and credit sales. The money collected in cash is never accounted for in your accounts receivable ledger. Therefore, to keep things honest, you need to eliminate this transaction from top number. This allows you to measure the rate at which you collect on credit sales, not just total sales volume.
How to Calculate Accounts Receivable Turnover
You should also watch out for returns and allowances. If you ignore those, then turnover ratio will be skewed upward (since it’s a reduction in what you expect to recieve). The tool lets you account for those deductions from sales, which shows you net credit sales. That’s important, because you want to see more than just how many receivables there are. You want to know their quality.
Then there are write-offs. If you’re writing off bad debts, then you recognize that some of your receivables has dissapears. Should these be deducted from sales (to maintain a clean ratio)? Or kept as-is (to flag the issue)? You can toggle how the calculator treats write-offs and see how it impacts working capital. A high ratio based purely off write-offs misleads you. It hides the collection problem instead of solving it.
The second part of the equation is what we call average accounts receivable balance. To figure it out, take the starting and ending A/R balance for the period and divide by two. This averages out any peaks or valleys in your billing cycle. For example, if you do most of your billing at the end of each month, then your ending balance will spike up and skew the ratio if you rely on that snapshot alone. By using an average instead, you avoid the skewing effect and can get a solid starting point different than which to compare yourself.
Many B2B businesses has a healthy turnover rate of twelve times a year according to benchmarks. That means they collect their money within roughly thirty days. (That also matches the typical net thirty terms.)
If it’s lower then this number, you’re likely experiencing cash being trapped within the sales-to-cash cycle. For instance, perhaps your collection team isn’t following up fast enough when invoices go unpaid. Or maybe you granted credit to clients who were too risky to begin with.
The calculator will show how far off your collection period is from its target, so if your goal is to collect at net thirty, but you’re actualy hitting forty-five days, then you’ve got a fifteen-day drag on your cash flow. And that drag builds up with each invoice. It means you’re tying up money which otherwise could of been used to pay for operations or growth.
You want the ratio to match up with your business plan. If it’s very high, perhaps your credit terms are too aggressive and are pushing off good customer. If it’s low, then you’re financing your customer’s purchase at your own expense. So you want something in between, something that supports sales but doesn’t cost you cash.
This one is more of a measure of friction within your revenue cycle. Whether you’re a manufacturer shipping goods on net sixty terms or a SaaS company charging for annual contracts, it’s still the same: You want to turn paper promises into liquid assets as fast as possible. The tool measures how quickly you do so.
Then it’s up to you to take action based off that information, keep an eye on aging buckets, make sure each invoice is in its way to getting paid, and consider tightening your credit policy to match. That’s how you stabilize your financial operations.