Win Loss Rate Calculator
Enter wins, losses, and ties for any game or sport to get your win percentage, win-to-loss ratio, total games, games needed to hit a target rate, and a projection over a full season.
🏆Quick Record Presets
📝Your Record
Set to 0 for games that cannot end in a tie.
Games-to-target assumes future results are straight wins.
🔢Formula Snapshot
📊Win Rate To Ratio
| Win % | W/L Ratio | Reads As | Sample Record | Meaning |
|---|---|---|---|---|
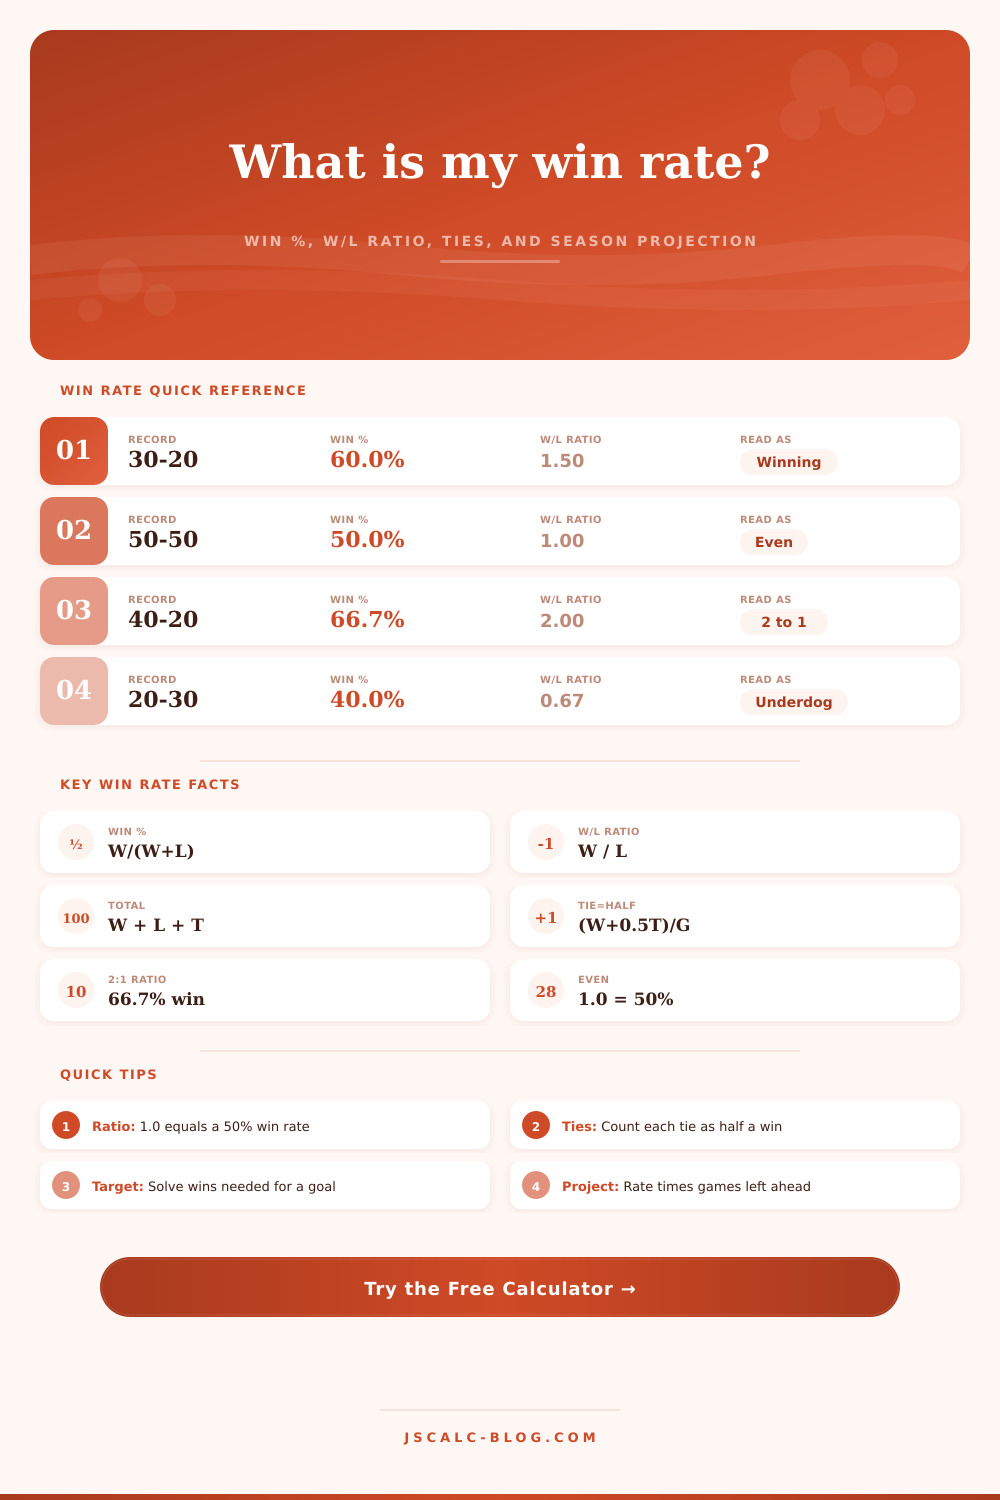
| 33.3% | 0.50 | 1 : 2 | 10-20 | Loses twice as often |
| 40.0% | 0.67 | 2 : 3 | 20-30 | Underdog record |
| 50.0% | 1.00 | 1 : 1 | 25-25 | Even, break-even |
| 60.0% | 1.50 | 3 : 2 | 30-20 | Solid winning side |
| 66.7% | 2.00 | 2 : 1 | 40-20 | Twice as many wins |
| 75.0% | 3.00 | 3 : 1 | 45-15 | Dominant record |
| 80.0% | 4.00 | 4 : 1 | 48-12 | Elite ladder tier |
🎯Win Rate Benchmarks
| Tier | Win % Range | Ratio Range | Typical Context |
|---|---|---|---|
| Rebuilding | Under 40% | Below 0.67 | Losing more than winning |
| Break-even | 45% to 55% | 0.82 to 1.22 | Roughly even matchups |
| Winning | 55% to 60% | 1.22 to 1.50 | Playoff or promotion range |
| Strong | 60% to 70% | 1.50 to 2.33 | Contender or high ladder |
| Elite | 70% and up | 2.33 and up | Top tier or championship form |
⚖Ties Handling Compared
| Method | Formula | 30-20-10 Result | When To Use |
|---|---|---|---|
| Exclude ties | W / (W + L) | 60.0% | Ratio games, ladders, esports |
| Ties as half | (W + 0.5T) / G | 58.3% | Soccer, hockey, NFL standings |
| Ties as no win | W / G | 50.0% | Strict win-only percentage |
| Points style | (3W + 1T) / (3G) | 55.6% | League points percentage |
🔮Season Projection Examples
| Current Rate | Season Games | Projected Wins | Projected Losses | Final Record |
|---|---|---|---|---|
| 60.0% | 82 | 49 | 33 | 49-33 |
| 55.0% | 82 | 45 | 37 | 45-37 |
| 50.0% | 82 | 41 | 41 | 41-41 |
| 66.7% | 17 | 11 | 6 | 11-6 |
| 70.0% | 38 | 27 | 11 | 27-11 |
| 40.0% | 50 | 20 | 30 | 20-30 |
🗂Record Comparison Grid
| Record (W-L) | Total | Win % (excl ties) | W/L Ratio | Read As | Standing |
|---|---|---|---|---|---|
| 10-20 | 30 | 33.3% | 0.50 | 1 : 2 | Rebuilding |
| 20-30 | 50 | 40.0% | 0.67 | 2 : 3 | Underdog |
| 25-25 | 50 | 50.0% | 1.00 | 1 : 1 | Even |
| 30-20 | 50 | 60.0% | 1.50 | 3 : 2 | Winning |
| 40-20 | 60 | 66.7% | 2.00 | 2 : 1 | Strong |
| 45-15 | 60 | 75.0% | 3.00 | 3 : 1 | Elite |
| 48-12 | 60 | 80.0% | 4.00 | 4 : 1 | Top tier |
| 60-0 | 60 | 100% | ∞ | All wins | Flawless |
⚙Full Formula Breakdown
💡Win Rate Tips
You lost twenty games. Thirty won. And you realize that you’re winning more than you’re losing. But the brain doesn’t like it when there’s more than one metric used to measure its performance. Enter the win loss rate calculator. This thing collects all of the random game results and reduces them down to one number, one number that shows the entire story in a glance. All you do is put in your record, and math gets done by the tool itself. Then it shows you how to understand what that number realy means for you personally or as a team.
Your first choice will be whether to include ties in the total number of games. You’d think it wouldn’t matter much but it does: in some leagues they don’t bother with ties at all for the purposes of figuring out someone’s winning percentage; in other leagues they’re half a win. Select this option and the calculator will adjust everything to match your rules of play. For example, if you were keeping track of an esports ladder that doesn’t allow draws, you aren’t counting the draw. Alternatively, if you were looking up soccer or hockey standings, you probably want ties to register as half-wins because that’s how points are scored anyway. Getting this part right means your percentage will compare against everyone else in the league. It is a small choice but it is important.
How to Use the Win Rate Calculator
You can express your win/loss ratio as a multiple after you know your win percentage. Analysts tend to be a multiple folk; expressing things as a multiple instead of as a fraction just makes sense to them. If you win 3 for every 2 you lose, you say that it’s a 1.5 ratio, which sounds more ballsy than saying 60 percent, but really it’s expressing the same thing. The table near the top of the page show you how the numbers correspond from fractions to ratios. While most folks will lean toward one or the other, having a handle on both will help when you’re trying to digest analysis from various sources.
The calculator can also help you determine how many more straight-up Ws you’ll need to achieve a particular goal, say, a 65 percent winning percentage needed to qualify for playoffs. It starts to get mathy here because each extra game makes your current results a little bit less meaningful. If you’re already behind on your goal, you may have to pull off an improbably long run just to make up some ground. Before you think anything is possible, let the cold hard math show you how far away from your goal you actualy are.
These numbers is useful not just for short term predictions, but also for long term planning. You have a current win percentage? Project out what your record will be at the end of a seventeen-game football season or an eighty-two-game NBA season. Of course, that’s only assuming you’ll keep playing at your current level, and that doesn’t often happen in the real world. Rosters change, players get hurt, players tires. But, it provides a baseline. It helps you keep your emotions in check throughout the regular season. Every win isn’t a miracle, and every loss isn’t a complete disaster.
It’s great to be on a winning streak, but it can skew your long-term rate. For instance, you could have a mediocre player who goes on a five-game winning run and gets lucky, so now she look like an elite player, at least for this week. But her underlying problems will re-emerge once the hot hand goes cold. Frequency of success, not quality of success. Is what the calculator measure. Your job is to provide context.
What are those victories against: tough opponents or easy ones? And, are the percentages trending upward or sideways? Those questions is more important than the number. The bottom line is that a win rate is nothing more than a look back at what has occured. Unless you know the reasons behind those wins, it’s no more predictive of future results then flipping a coin. Use this as a way to set reasonable expectations, identify slumps, and detect trends. However, also keep in mind that numbers are only half of the equation. The other half is the quality of play that generated them.