Input Lag Calculator
Add up every stage of latency between your button press and the photon leaving the screen. This tool sums peripheral polling wait, USB and OS overhead, the render queue, monitor refresh wait, display signal processing and pixel response into one honest end-to-end input lag figure in milliseconds.
🎮Real Setup Presets
🖥Latency Chain Inputs
Mouse or controller report rate. Average wait = 500 / Hz.
USB stack plus operating system and driver handling.
Frames per second. One frame time = 1000 / FPS ms.
Engine render queue. Each frame adds one frame time.
Panel refresh. Average scan-out wait = 500 / Hz.
Panel electronics, scaler and overdrive lookahead.
Grey-to-grey time for the pixel to finish the transition.
Optional human component, added only to the click-to-act total.
🧮Stage Formula Snapshot
⏳Polling Rate to Average Wait
| Polling Rate | Report Interval | Average Wait | Typical Device |
|---|---|---|---|
| 125 Hz | 8.00 ms | 4.00 ms | Old USB mouse |
| 250 Hz | 4.00 ms | 2.00 ms | Basic gaming mouse |
| 500 Hz | 2.00 ms | 1.00 ms | Mid gaming mouse |
| 1000 Hz | 1.00 ms | 0.50 ms | Standard esports mouse |
| 2000 Hz | 0.50 ms | 0.25 ms | High-end wireless |
| 4000 Hz | 0.25 ms | 0.13 ms | Flagship 4K mouse |
| 8000 Hz | 0.13 ms | 0.06 ms | 8K polling mouse |
📺Refresh Rate to Frame Time and Wait
| Refresh Rate | Refresh Interval | Average Wait | 1 Frame at FPS = Hz |
|---|---|---|---|
| 60 Hz | 16.67 ms | 8.33 ms | 16.67 ms |
| 75 Hz | 13.33 ms | 6.67 ms | 13.33 ms |
| 120 Hz | 8.33 ms | 4.17 ms | 8.33 ms |
| 144 Hz | 6.94 ms | 3.47 ms | 6.94 ms |
| 165 Hz | 6.06 ms | 3.03 ms | 6.06 ms |
| 240 Hz | 4.17 ms | 2.08 ms | 4.17 ms |
| 360 Hz | 2.78 ms | 1.39 ms | 2.78 ms |
| 540 Hz | 1.85 ms | 0.93 ms | 1.85 ms |
📊Pixel Response and Display Lag by Panel
| Panel Type | Pixel GtG | Signal Proc | Best Use |
|---|---|---|---|
| TN esports | 1 ms | 1 ms | Competitive FPS |
| Fast IPS | 2 ms | 2 ms | All-round gaming |
| Standard IPS | 4 ms | 3 ms | Mixed work and play |
| VA gaming | 5 ms | 3 ms | High contrast games |
| OLED gaming | 0.3 ms | 2 ms | HDR and motion |
| 4K TV game mode | 6 ms | 12 ms | Console on the couch |
| 4K TV cinema mode | 8 ms | 60 ms | Movies, not games |
🗃Full Setup Input Lag Comparison Grid
| Setup | Poll Hz | FPS | Refresh Hz | Display Lag | Total Lag | Tier |
|---|---|---|---|---|---|---|
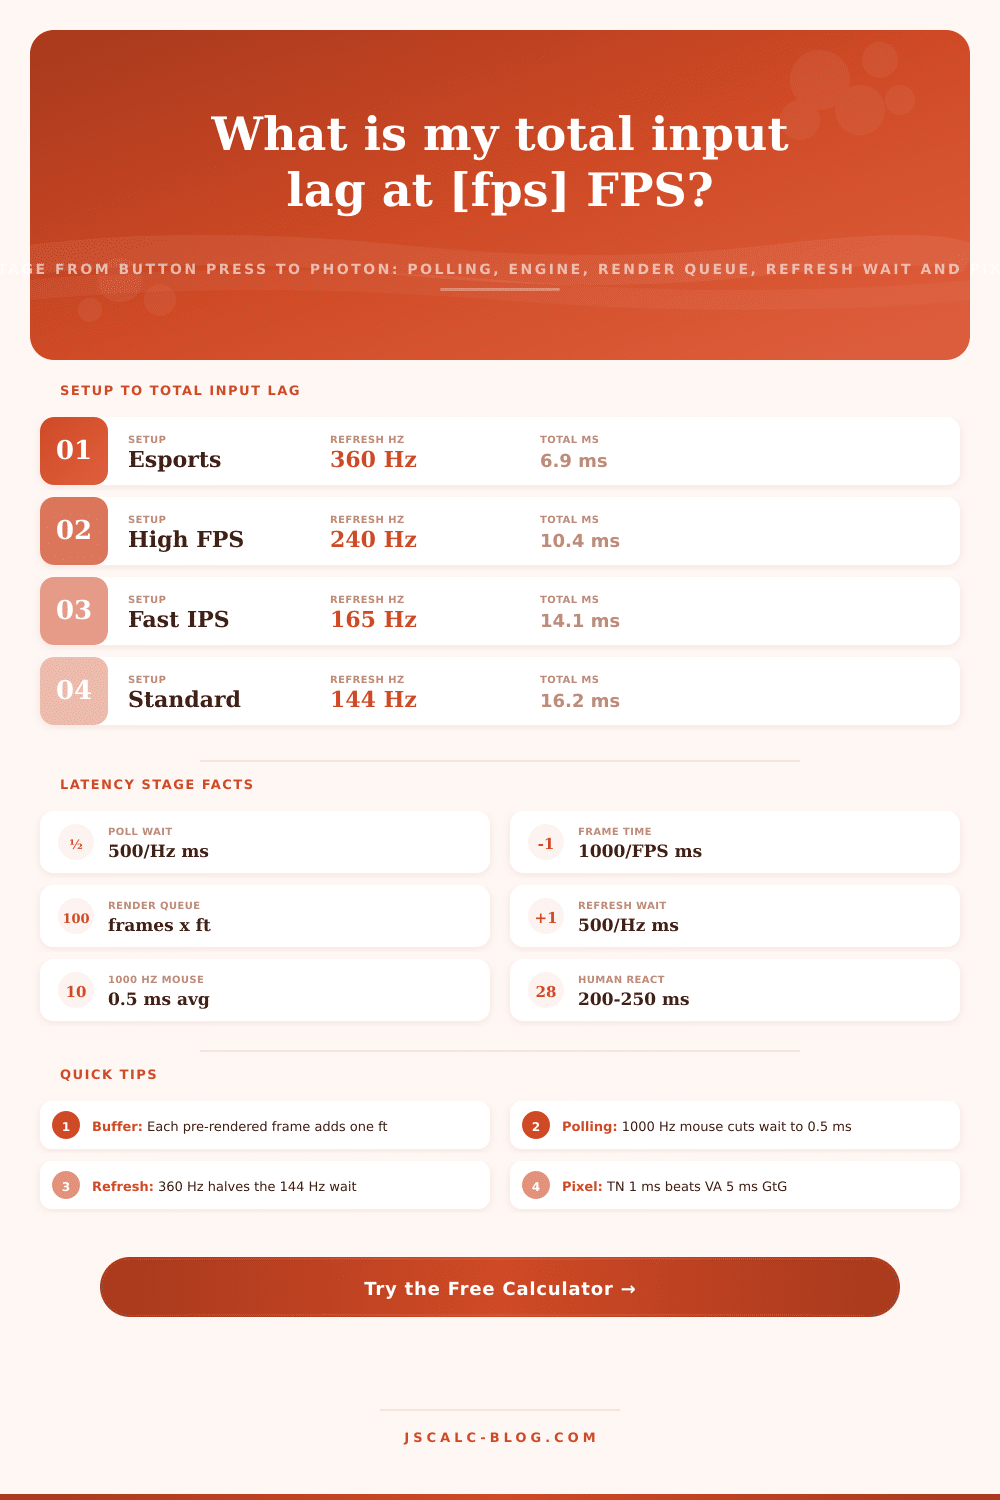
| Pro esports | 8000 | 360 | 360 | 2.4 ms | 6.9 ms | Elite |
| High FPS build | 1000 | 240 | 240 | 6.1 ms | 10.4 ms | Excellent |
| Fast IPS gamer | 1000 | 165 | 165 | 7.0 ms | 14.1 ms | Great |
| Standard 144 Hz | 1000 | 144 | 144 | 8.5 ms | 16.2 ms | Good |
| Casual 120 Hz | 500 | 120 | 120 | 9.2 ms | 19.0 ms | Good |
| Console 60 FPS | 250 | 60 | 60 | 14.3 ms | 33.5 ms | Fair |
| Office 60 Hz LCD | 125 | 60 | 60 | 18.3 ms | 41.0 ms | Sluggish |
| Vsync triple buf | 1000 | 60 | 60 | 14.3 ms | 50.2 ms | Sluggish |
| TV game mode | 125 | 60 | 60 | 26.3 ms | 78.5 ms | Laggy |
| Cloud gaming | 125 | 60 | 60 | 18.3 ms | 95.0 ms | Laggy |
⚙Formula Breakdown
💡Latency Tuning Tips
How many milliseconds does it take for a button press to show up on the screen? The Input Lag Calculator at JSCalc-Blog.com knows the answer: it’s not just a number from a spec sheet. It’s a sum. It goes from your finger to the screen, then to the controller chip, to the video card, and finally to monitor’s pixels. Each of these builds latency. This calculator add them all up. It gives one number in milliseconds.
What do you need to fix first? Where is the delay coming from? Response time of one millisecond, this is what you see monitor makers advertise. And that refers to just the time it takes a pixel to change colors. It doesn’t take into account any of the other steps required to draw on screen. These include waiting for your mouse to report and OS processing time. It also includes frame time spent sitting in the render queue and actual time taken by the panel itself to draw. Each of those times adds up because they all happen one after another. So even if your pixels is switching super fast, your display might still feel laggy because its refresh rate is slow or the render queue is long. This entire chain is what input lag mean; the calculator models it out.
How to Fix Your Input Lag
There are six steps from click to photon. The first step is peripheral poll wait, which is half a report period on average while waiting for your controller or mouse to report back. That’s 500 over the polling rate, in hertz. Step two is OS/USB processing, the overhead of getting that input through the operating system and drivers. Step three is render queue, each pre-rendered frame stored in engine’s buffer adds one full frame time of delay. Step four is the monitor refresh wait, which is half a refresh interval on average (500 divided by refresh rate). Step five is display signal processing lag, which is the lag from the electronics inside your monitor panel. And sixth is pixel response… How long it takes for your pixels to transition to the right color.
Add them all together and there’s your total system input lag. Put all those numbers into a formula, though. Put them in a chart. Then it’s easy: poll wait = 500/polling hertz. Mouse average at 1000 hertz is 0.5 milliseconds. Frame time = 1000/frames per second. At 240 FPS, that’s 4.17 milliseconds per frame. Render queue times the frame time by the number of buffered frames. Display times the refresh wait (500/refresh hertz). So a 240 hertz panel is 2.08 milliseconds. Add to that signal processing + pixel response + refresh wait. That is the display part. Add up the peripherals, operating system, render, and display to get your total. Every part counts fully. No overlap. Every part contribute to what you feel.
To do this, it breaks out results into four cards to identify bottlenecks: Total System Input Lag (no reaction time included). Peripheral & Operating System Portion, Processing Overhead + Poll Wait Render & Engine Portion, Frame Rate + Buffer Depth Display Portion, Pixel Response + Signal Processing + Refresh Wait These are presented together for comparison so you can see which part of your setup has lag, is it in the mouse? Game engine? Monitor? Then you know what to spend money on and tweak.
The tests span multiple gaming scenarios; there are ten profiles all together. The Esports 360 hertz profile with an 8000 hertz mouse and an empty render queue lands under seven milliseconds of total system lag. That’s fast! The Standard 144 hertz build has a lag of near sixteen milliseconds (good for most players). The Console 60 FPS setup hits the thirties. The Vsync triple buffer profile shows how much more than fifty milliseconds a 60 hertz display can reach with a deep frame queue. Cloud gaming and TV game mode presets illustrate how network overhead and signal processing push lag into the hundreds of millisecond. Testing each profile helps you understand the cost of each step along the way.
Break down the chain, and priorities emerge. At the software level, the highest-hanging fruit (usually) is the render queue. By dropping to zero buffered frames at 60 FPS, you save about fifty milliseconds for free. The next factor is refresh rate. Going from 144 to 360 hertz reduces not only per-frame render time but also refresh wait. The easiest thing to improve on high-end gear is the polling rate. Going from 1000 to 8000 hertz saves less than half a millisecond. By capping your frame rate just below your refresh rate, you keep the queue full and eliminate the delay that annoys players the most.
That also means separating the human from the machine. Typically, system stages are seven to one-hundred milliseconds long. Human reaction time is two hundred to two hundred-fifty millisecond long. And that’s much greater than the amount of lag in the system. So there’s an optional reaction field on the calculator that lets you visualize the complete loop. What this shows isn’t that humans dominate. It’s that your reaction is set. For every millisecond the system shaves off for you, it’s a millisecond that you would of had otherwise. Lag shaving is one of those rare edges you get as a human.
Begin with presets near your configuration. Tweak inputs to suit your specific monitor, frame rate, and mouse. The total and the four cards will update live. Scroll down for a breakdown of the formula and how it applies to your specific numbers. Compare your result to popular tiers using our comparison grid. If you’re setting up for competition or wondering what to upgrade next, this tool translates vague delay into actionable millisecond numbers.