Frames Per Second Calculator
Turn a raw frame count and the elapsed capture time into average FPS, average frame time in milliseconds, 1% low and 0.1% low FPS from your worst frames, and the total render or playback time. Built for game benchmarks, engine profiling, and video export runs where throughput over time is what matters.
🎛Choose a Mode
🎯Real Benchmark Presets
📝Benchmark Inputs
Count of frames captured across the whole run.
Duration the frames were measured over.
Applies to the elapsed time above.
How you supply the slow-frame data below.
Longest frame in the slowest 1 percent bracket.
Longest frame in the slowest 0.1 percent bracket.
Used to size render time for the frame count.
Controls rounding on every result card.
🔢Formula Snapshot
📊Frames and Time to Average FPS
| Frames Rendered | Elapsed Seconds | Average FPS | Reads As |
|---|---|---|---|
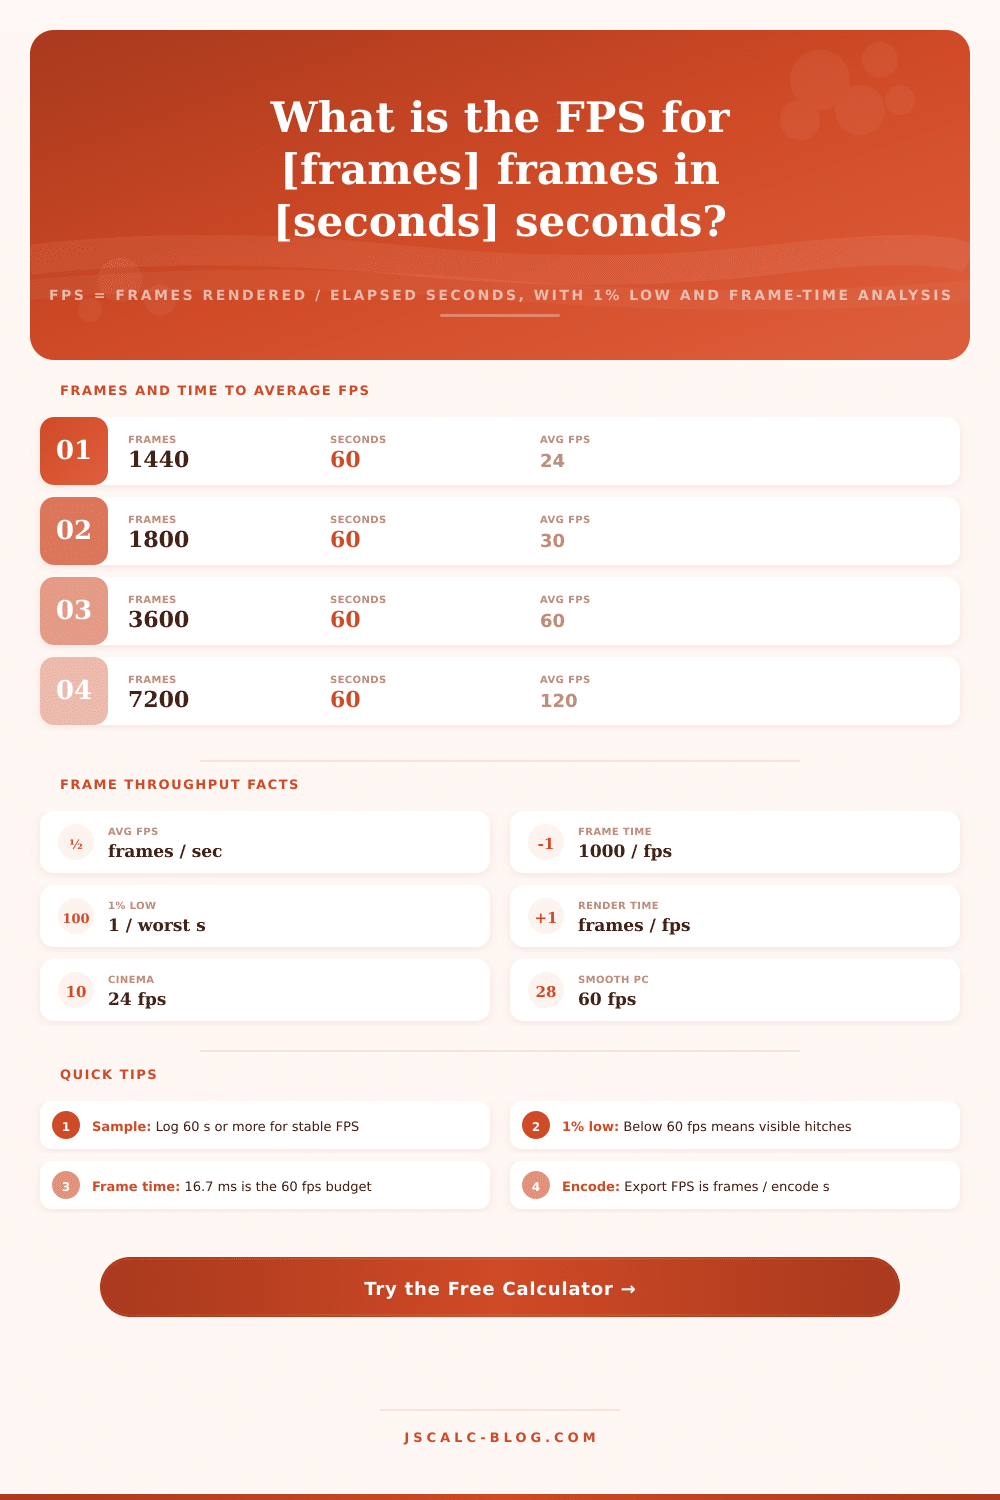
| 1,440 | 60 s | 24 fps | Cinematic |
| 1,800 | 60 s | 30 fps | Console cap |
| 3,600 | 60 s | 60 fps | Smooth PC |
| 7,200 | 60 s | 120 fps | High refresh |
| 8,640 | 60 s | 144 fps | Esports |
| 14,400 | 60 s | 240 fps | Competitive |
| 600 | 10 s | 60 fps | Short clip |
| 500 | 5 s | 100 fps | Burst test |
⏱FPS to Frame Time Budget
| Frame Rate | Frame Time | Frames in 1 s | Frames in 60 s | Typical Use |
|---|---|---|---|---|
| 24 fps | 41.67 ms | 24 | 1,440 | Film, cinematics |
| 30 fps | 33.33 ms | 30 | 1,800 | Console, mobile |
| 48 fps | 20.83 ms | 48 | 2,880 | HFR film |
| 60 fps | 16.67 ms | 60 | 3,600 | Standard PC |
| 90 fps | 11.11 ms | 90 | 5,400 | VR headsets |
| 120 fps | 8.33 ms | 120 | 7,200 | High refresh |
| 144 fps | 6.94 ms | 144 | 8,640 | Esports panels |
| 240 fps | 4.17 ms | 240 | 14,400 | Competitive FPS |
🎮1% Low and 0.1% Low Ratings
| Avg FPS | 1% Low | 0.1% Low | 1% Low Ratio | Feel |
|---|---|---|---|---|
| 60 fps | 55 fps | 48 fps | 92% | Very smooth |
| 60 fps | 36 fps | 24 fps | 60% | Noticeable hitch |
| 120 fps | 96 fps | 72 fps | 80% | Smooth |
| 144 fps | 110 fps | 82 fps | 76% | Good |
| 144 fps | 60 fps | 40 fps | 42% | Uneven pacing |
| 240 fps | 180 fps | 140 fps | 75% | Consistent |
| 30 fps | 22 fps | 15 fps | 73% | Acceptable |
🗄Scenario Comparison Grid
| Scenario | Frames | Seconds | Avg FPS | Frame Time ms | Rating |
|---|---|---|---|---|---|
| Cinematic film | 1,440 | 60 | 24.00 | 41.67 | Film look |
| Console cap | 1,800 | 60 | 30.00 | 33.33 | Playable |
| PC smooth | 3,600 | 60 | 60.00 | 16.67 | Smooth |
| VR headset | 5,400 | 60 | 90.00 | 11.11 | Comfort floor |
| High refresh | 7,200 | 60 | 120.00 | 8.33 | Fluid |
| Esports panel | 8,640 | 60 | 144.00 | 6.94 | Fast |
| Competitive | 14,400 | 60 | 240.00 | 4.17 | Elite |
| 4K export | 7,200 | 900 | 8.00 | 125.00 | Encode bound |
| 1080p encode | 3,600 | 120 | 30.00 | 33.33 | Realtime |
| Timelapse out | 1,800 | 72 | 25.00 | 40.00 | Batch render |
⚙Formula Breakdown
💡Benchmark Reading Tips
To determine your graphics performance speed, use Frames Per Second Calculator. What’s this? Frames per second (FPS) represents rate at which a system draws frames relative to the time required. How do you use it? Feed the Frames Per Second Calculator with elapsed capture time (i.e., how long did it take?) and a raw frame count. It will show your total render or playback time, average FPS, and average frame time in milliseconds. It will also shows your 0.1% low and 1% low FPS from your worst frames.
What does it do? It’s a throughput calculator that works around frames over time, matching how video exports and real benchmarks is measured. This section explains what frames per second realy measures. It’s a rate. If you draw 3,600 frames over 60 seconds, you’re doing (wait for it) 3,600/60 = 60 frames per second. That one division is the heart of all benchmark overlays. FPS isn’t actualy something about any given frame; it’s just an average of some span of time.
What Frames Per Second Means
Because of this, longer spans of time gives more steady numbers, one slow frame gets diluted by thousands of normal ones. Rather than a snapshot, the calculator wants to know how long it took, and how many frames got rendered during that time. Those two things is the true average across all samples.
Average Frame Time in Milliseconds
Frame time is another way to look at frame rate. Frame time is the time (in milliseconds) required to render an average frame. So if your FPS is 60, then each frame will take approximately 16.67 ms. If your FPS is 30, then each frame takes about 33.33 ms. If your FPS is 120, then each frame takes roughly 8.33 ms. To get this value from the log, divide elapsed milliseconds by frame count. So 60,000 ms over 3,600 frames gives us 16.67 ms again.
Why does frame time matter? Because it’s linear in terms of how much work a system has to do. When you’re looking for a bottleneck, it’s the better yardstick.
What do 0.1% low and 1% low mean? Averaging an FPS hides some roughness. It’s possible to have two runs where both average 144 fps but one feels glassy, while other stutters because of occasional stalls. That’s why we’re looking at 1% low and 0.1% low. That’s for the slowest 1 percent of frames and then the slowest 0.1 percent of frames, reporting the FPS during those worst moments.
The calculator simply looks at the worst frame time you provide and converts that using formula: 1000 divided by that time. So a slowest frame of 28 ms will show as a 1% low around 35.7 fps. And a frame that’s even deeper into the stall (e.g., 42 ms) will show up as a 0.1% low around 23.8 fps. Those floors are typically what your eyes see, not the headline average.
A Quick Verdict: The 1% Low Ratio as a Smoothness Score
Turning the low numbers into a quick verdict, the tool takes the 1% low number, divides it by the average, and expresses it as a percentage. If your game has an average of 60 frames per second (fps) but your lowest 1% dips down to 55, that’s still around 92 percent, which is plenty smooth. However, if same game averages 60 fps, but its 1% low drops to just 36 fps, that’s only 60 percent, and you’ll see some hitching on screen.
Keeping your 1% low at or above about 75 percent of the average is what makes the difference between fluid motion and feeling like something is getting in the way. It’s easy to get caught up chasing higher average while letting your 1% low collapse, this ratio helps you not do that.
Video Export Mode and Render Time
When exporting footage rather than playing it back, same frames-over-time math happens in reverse. So if your footage is 3,600 frames long, at 60 fps, it’s 60 seconds of final video, (frame count)/(target rate) = render or playback time. Flip the calculator into video export mode and it frames numbers around encoding.
At 8 fps, an editor shoves a 7,200-frame clip through in 900 seconds; it’ll play back at 24 but that’s an effective throughput of only 8 fps. That’s why export progress bars and benchmark counters may report wildly different FPS from the exact same footage: one is recording in real time, the other rendering in slower-than-real time.
Time units are not consistent across benchmark logs and profilers, so the calculator takes elapsed time expressed in minutes, milliseconds, or seconds and scales everything down to seconds for division. Unit scale-downs are automatic. For example, a five-minute stress test entered as minutes turns into 300 seconds. Similarly, a timer from your engine profiler in milliseconds will be divided by a thousand to scale it down.
If you want to feed it number of frames for a slow section, you can express that either in milliseconds as a frame time or as a momentary FPS value. The calculator will then flip whichever one you select to invert it. This saves you having to do any math conversions yourself just before the actual calculation.
We load realistic runs on all common targets with presets. A 60 fps smooth PC session, a deliberate 60 fps average, a competitive capture at 240 fps, benchmarking at 120 and 144 fps high refresh, a 90 fps VR headset run, a 30 fps console cap and a 24 fps cinematic pass, plus two export jobs set to 1080p and 4K. Fill them all out and recalculate immediately so you can watch the render time, the low metrics, and the frame time shift with target rate. And they provide sense of reference for what is and isn’t a healthy 1% low at any given frame rate.
Tables for Reading
The calculator translates formulas into lookup tables: One maps frame counts and seconds directly to average FPS; one has frame time budget for each common rate (from 24 all the way through 240); one displays a smoothness-feel value for 1% low and 0.1% low; and a broad comparison table puts a range of typical scenarios, ranging from cinematic film to 4K export (in a side-by-side grid comparing frames), seconds, average FPS, frame time and even rating.
Combined with the formula breakdown where you plug in your own numbers, it’s a full-on throughput reference… Not just a one-answer box. Pick a preset, change the frame count/time, then read down the four cards to get a clear picture of what kind of speed you’re running at.