Wien Law Peak Wavelength Calculator
Calculate blackbody peak wavelength from temperature with nanometer, micrometer, frequency, and UV, visible, or infrared band classification.
Wien Law Results
Main law: λmax = b / T, where b = 2.897771955e-3 m K and T is absolute temperature in kelvin.
Unit conversion: meters × 1,000,000,000 gives nanometers, and meters × 1,000,000 gives micrometers.
Frequency: f = c / λ using c = 299,792,458 m/s. The calculator reports THz, GHz, MHz, or Hz by scale.
Band classification: the computed peak wavelength is compared with gamma, X-ray, ultraviolet, visible, infrared, microwave, and radio ranges.
Air option: when selected, visible and near-infrared wavelengths are divided by an approximate refractive index of 1.000277.
Redshift option: z stretches the displayed observed peak by (1 + z), while the rest-frame Wien result remains tied to source temperature.
| Example Source | Temperature | Peak nm | Peak µm | Frequency | Band |
|---|---|---|---|---|---|
| Cosmic microwave background | 2.725 K | 1,063,402 | 1063.4 | 282 GHz | Microwave |
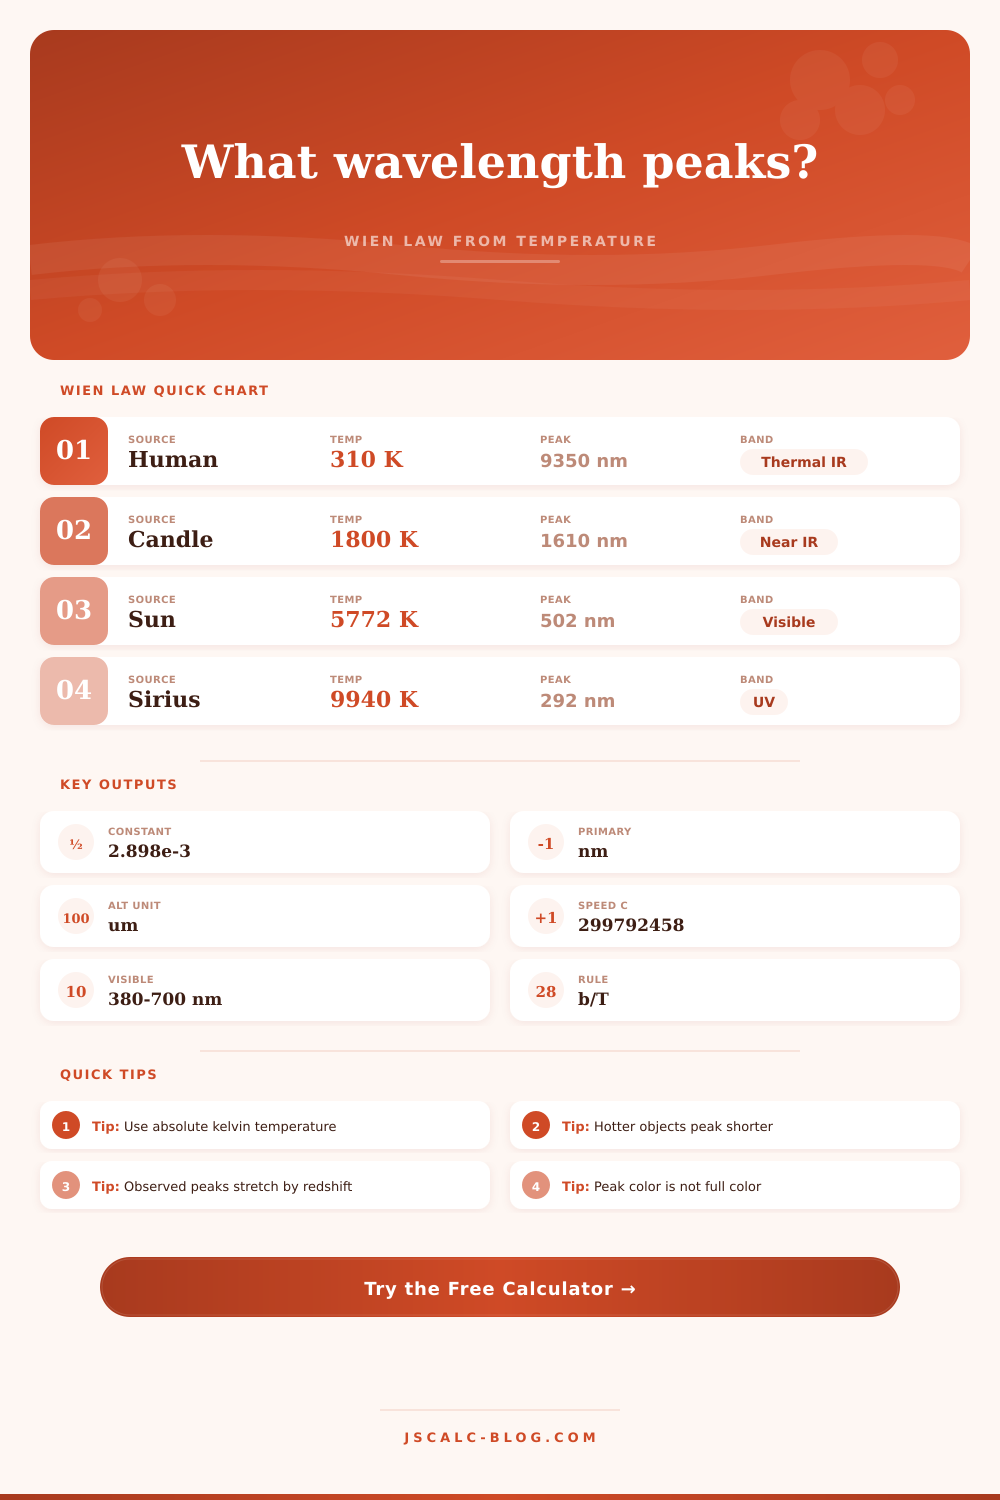
| Human skin emission | 310 K | 9,348 | 9.35 | 32.1 THz | Thermal infrared |
| Warm soldering iron | 673 K | 4,306 | 4.31 | 69.6 THz | Mid infrared |
| Candle flame glow | 1,800 K | 1,610 | 1.61 | 186 THz | Near infrared |
| Tungsten filament | 2,800 K | 1,035 | 1.04 | 290 THz | Near infrared |
| Solar photosphere | 5,772 K | 502 | 0.502 | 597 THz | Visible |
| Blue-white star | 10,000 K | 290 | 0.290 | 1035 THz | Ultraviolet |
| Hot O-type star | 30,000 K | 96.6 | 0.0966 | 3104 THz | Ultraviolet |
| Band | Approx Wavelength Range | Wien Temperature Range | Calculator Note |
|---|---|---|---|
| Gamma ray | Below 0.01 nm | Above 2.9e11 K | Extreme high energy peak |
| X-ray | 0.01 to 10 nm | 2.9e5 to 2.9e11 K | Very hot plasma range |
| Ultraviolet | 10 to 380 nm | 7,626 to 289,777 K | Hot stars often peak here |
| Visible | 380 to 700 nm | 4,140 to 7,626 K | Human-eye color range |
| Infrared | 700 nm to 1 mm | 2.90 to 4,140 K | Thermal objects usually peak here |
| Microwave | 1 mm to 1 m | 0.0029 to 2.90 K | Cold cosmic background scale |
| Radio | Above 1 m | Below 0.0029 K | Long-wavelength peak display |
| Object Or State | Temperature K | Temperature °C | Peak Wavelength |
|---|---|---|---|
| Liquid nitrogen environment | 77 K | -196 °C | 37.6 µm |
| Comfortable room object | 293 K | 20 °C | 9.89 µm |
| Boiling water surface | 373 K | 100 °C | 7.77 µm |
| Dull red hot metal | 900 K | 627 °C | 3.22 µm |
| Molten iron estimate | 1,811 K | 1,538 °C | 1.60 µm |
| Incandescent filament | 2,800 K | 2,527 °C | 1.04 µm |
| Daylight-like blackbody | 6,500 K | 6,227 °C | 446 nm |
| Peak Region | Approx Range | Wien Temperature | Interpretation |
|---|---|---|---|
| Violet | 380 to 450 nm | 6,439 to 7,626 K | Peak is at the short visible edge |
| Blue | 450 to 495 nm | 5,854 to 6,439 K | Common for daylight-like sources |
| Green | 495 to 570 nm | 5,084 to 5,854 K | Solar peak falls near this region |
| Yellow | 570 to 590 nm | 4,912 to 5,084 K | Peak still has broad visible output |
| Orange | 590 to 620 nm | 4,674 to 4,912 K | Cooler visible peak region |
| Red | 620 to 700 nm | 4,140 to 4,674 K | Long visible edge before infrared |
Use kelvin for physics checks. Celsius and Fahrenheit are convenient inputs, but Wien law uses absolute temperature. A zero or negative kelvin result is not physically valid.
Do not treat peak wavelength as the only emitted color. A blackbody emits a wide spectrum, so a visible peak, infrared peak, or ultraviolet peak describes the maximum, not the full output.
Thermal radiation lets you see temperature. As an object warms, its heating element go from a dull red, to bright orange, to white hot. Its color change show energy levels. The white-hot coil has higher energy then the red one. You don’t need a thermometer, because light shows you the energy. All you have to know is how light interacts with matter.
Wien’s displacement law captures the physics of this glow by relating an object’s temperature to the wavelength at which it radiates maximum energy. To perform the math, this page include a handy calculator. But to use those numbers out in real world, it helps to grasp the logic behind them. It’s all about inverse proportionality: The higher the temperature, the lower the peak wavelength.
How to See Temperature with Color
In other words, cooler objects radiate toward longer (redder or infrared) wavelengths, whereas hotter objects does so at shorter (bluer) ones. The amount of this shift is determined by something called Wien’s displacement law, which uses a constant approximately equal to 2.9 millimeter-kelvins, and the ratio of this constant and the temperature expressed in kelvin result in the peak wavelength. Divide the constant by the temperature to get a number in nanometers or micrometers. This allows you to look it up in a table of spectral bands.
That is why we built this tool; it does the calculation for you immediately and expresses the result as both a wavelength and an equivalent frequency using speed of light. Radio astronomers tend to think in frequency, while people who work with optical stuff tend to think in wavelength. So the calculator fills that gap too, no need to convert units manually.
The other thing most people don’t realize about blackbodies: they radiate a whole spectrum! The peak wavelength is simply the hump in the distribution; however there is radiation coming out at all wavelengths, just in different amounts. That’s why a candle flame looks yellow even though your skin feels its warmth; the flame’s energy is strongest in the infrared spectrum. The yellow color is actualy the tail-end of a massive amount of infrared radiation emitted by the flame.
Similarly, stars like Sirius appear blue-white because they emit so much light throughout visible spectrum, and the part at the blue end are more prominent than the rest. But we can’t see the peak, it’s somewhere in the ultraviolet. The calculator tells you what range the peak lies in (UV, visible or infrared), so you won’t make error of thinking something only emits where the peak is.
This means using the proper temperature scale. For this application, there’s no wiggle room: the physics demands that we take absolute zero into account, and plugging in the temperature in either Fahrenheit or Celsius will cause math to fail. Fortunately, the tool supports choosing your units, which it then changes internally to kelvin for use in the equation. Why? Because ten degrees makes a bigger difference when the temperature is lower than when it’s higher; they need to be on the same scale.
Astronomers also gets an additional problem in terms of realism with the redshift option. As light traverses an expanding universe, it gets stretched out; and the calculator accounts for this change in the observed peak wavelength based off the redshift factor. This isn’t its original color. Instead, it is the color seen during observation. This distinction between the observed and rest-frame peak matter a lot when analyzing things correctly.
The presets are a way to check your instincts. How about an extremely cold object, like the cosmic microwave background, at only 2.7 kelvin? That puts the maximum wavelength up into the microwave band, so it’s invisible without help of radio telescopes that allow us to observe the Big Bang’s afterglow.
Or what about a hot object (the sun), with a temperature near 5800 kelvin and a peak in the cyan-green part of visible spectrum? But the sun appears yellow, right? It doesn’t; our eyes don’t just perceive the peak wavelength. They integrate across the whole visible spectrum, and our brain perceives that mixture differently depending on atmosphere: sometimes as yellow, sometimes as white. What you see is full distribution, not the maximum wavelength (though the calculator will show you both).
Knowing this is key to avoiding confusion if the calculated maximum wavelength isn’t the same than the perceived color. It does include some handy reference tables on page for context. These show common sources like blue-white stars, oven elements, and even your own human skin. Then they shows what the maximum value is for each. Notice how just a small change in temperature moves something from visible to infrared radiation. At this point, we begin seeing objects glowing.
The limits are clearly noted on the calculator. That way you know whether the heat producing object you’re looking at would be visible or not. And it helps you decide if it requires thermal imaging. If you want more precise results you can set the number of significant digits for your comparison. This is useful if you are matching numbers that have different levels of accuracy.
When thinking about thermal physics, it’s easy to get tripped up by the fact that we perceive heat with our skin rather than our eyes. But using Wien’s law lets us see temperature in terms of wavelength and color. This turns an arbitrary number into a specific spot on the spectrum. Whether you’re looking at the light from a distant star, building a sensor, or simply wondering about the reason for red fire, it works the same: The peak location corresponds directly to temperature. If you know what to look for, you’ll be able to see the heat in the spectrum.