Solar Irradiance Calculator
Estimate solar irradiance in W/m², daily solar energy in kWh/m²/day, and power over a selected surface area.
☀️Real Solar Presets
📏Calculator Inputs
Solar Irradiance Results
🔢Formula Breakdown
🧭Solar Comparison Grid
📊Reference Tables
Solar Distance And Top-Of-Atmosphere Irradiance
| Location | Distance (AU) | Solar Constant / r² | Use Case |
|---|---|---|---|
| Venus orbit average | 0.723 | 2604 W/m² | Spacecraft estimates near Venus |
| Earth perihelion | 0.983 | 1409 W/m² | Early January top-of-atmosphere |
| Earth mean orbit | 1.000 | 1361 W/m² | Standard solar constant reference |
| Earth aphelion | 1.017 | 1316 W/m² | Early July top-of-atmosphere |
| Mars orbit average | 1.524 | 586 W/m² | Mars lander and rover planning |
| Jupiter orbit average | 5.203 | 50 W/m² | Outer solar system comparison |
Atmosphere And Clearness Factors
| Condition | Factor | Earth Noon Example | Notes |
|---|---|---|---|
| Space, no atmosphere | 1.00 | 1361 W/m² | Top-of-atmosphere or vacuum value |
| Clear dry sky | 0.82 | 1116 W/m² | High clarity, low aerosol loading |
| Typical clear sky | 0.74 | 1007 W/m² | Close to standard test condition sun |
| Humid or light haze | 0.64 | 871 W/m² | Water vapor and scattering reduce beam |
| Hazy urban sky | 0.52 | 708 W/m² | Aerosols and haze visibly soften shadows |
| Bright cloud cover | 0.30 | 408 W/m² | Diffuse light, weak direct beam |
| Dense overcast | 0.12 | 163 W/m² | Low irradiance under thick cloud |
Incidence Angle Multiplier
| Angle From Normal | cos(angle) | Clear-Sky W/m² | Interpretation |
|---|---|---|---|
| 0° | 1.000 | 1007 | Surface points directly at the sun |
| 15° | 0.966 | 973 | Minor loss from slight tilt error |
| 30° | 0.866 | 872 | Common morning or afternoon value |
| 45° | 0.707 | 712 | Substantial projected-area loss |
| 60° | 0.500 | 504 | Half of direct-normal irradiance |
| 75° | 0.259 | 261 | Grazing light near low sun |
| 90° | 0.000 | 0 | No direct beam on the surface |
Daily Solar Energy Examples
| Adjusted Irradiance | Peak Sun Hours | Daily Energy | Typical Reading |
|---|---|---|---|
| 1000 W/m² | 6.0 h | 6.00 kWh/m²/day | Very sunny high-resource day |
| 900 W/m² | 5.0 h | 4.50 kWh/m²/day | Strong clear-sky site |
| 750 W/m² | 4.5 h | 3.38 kWh/m²/day | Good but hazy conditions |
| 500 W/m² | 3.5 h | 1.75 kWh/m²/day | Cloudy or shaded part of day |
| 250 W/m² | 2.0 h | 0.50 kWh/m²/day | Weak winter or overcast estimate |
| 100 W/m² | 1.0 h | 0.10 kWh/m²/day | Dense cloud or very low sun |
💡Practical Calculation Tips
On a sunny day, you may think: “oh, there’s plenty of energy falling on my roof.” But that’s not true. The sun doesn’t radiate equally all hours of the day, nor does it fall straight onto everything in its path. Because of this, predicting how much solar you can get isn’t as simple as looking out your window to see what weatherman says. To translate the raw power of sunlight into useful electrons, we must consider geometry, atmosphere, and distance.
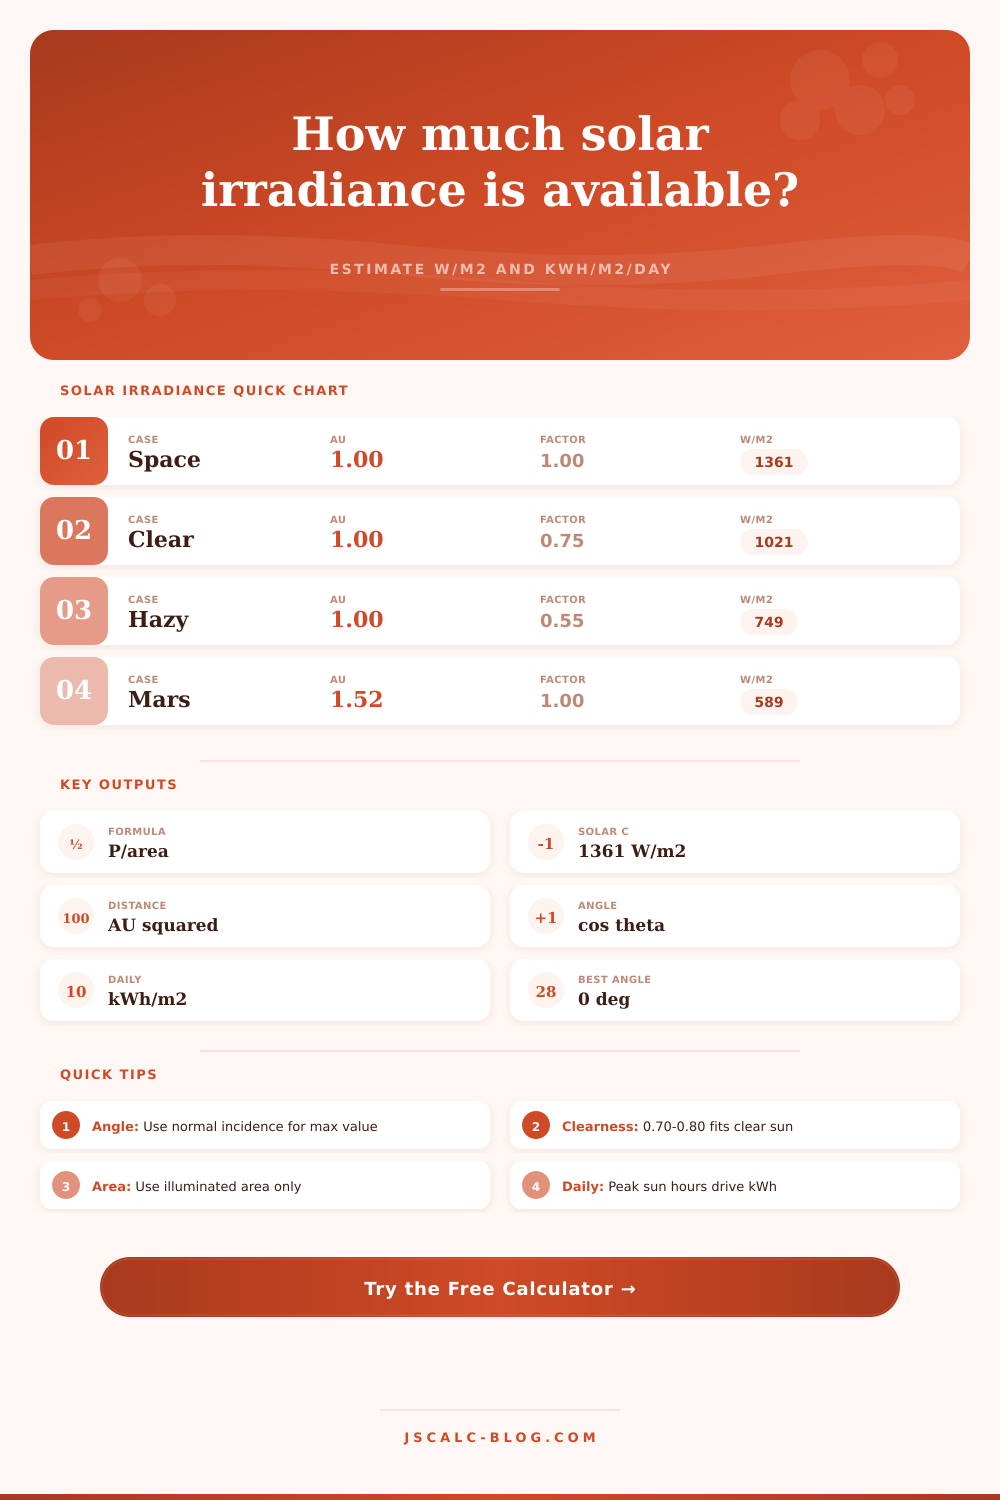
While the calculator will do the number crunching for you, knowing what goes in is where magic happens. First, consider the solar constant. On average, the sun sends roughly 1361 watts per square meter to earth in free space. That’s the base line; the theoretical max before clouds, dust or air gets between us and the sun.
How to Calculate Solar Energy
As soon as that light hits our atmosphere, however, it begin to fade. And here is where a clearness factor comes into play; a value which the calculator use to reduce incoming light. Imagine it as a discount rate. An ideal clear dry sky might reflect back as much as eighty-two percent of that top-of-atmosphere power, while an urban hazy sky could knock it down to less than half (around fifty-five percent). Why does this matter? Because how well your system performs depend greatly on this factor. Designing for perfect skies while living in a humid environment means you will produce less energy then you expect.
Angle is another factor that reduces efficiency. To get the most output, sunlight needs to hit the panel at right angles (the cosine effect). If the sun isn’t directly overhead, then it will hit at an angle on your panels. That means the same volume of light covers a greater projected surface area, so it dilutes its power-density. For example, if you have a fixed mount installed in winter, the average incidence angle is about 25 degrees. Irradiance is less effective. The calculator takes this into account by lowering the baseline based off the cosine of that incidence angle. Trigonometry math has important money consequences.
Notice that there’s another column for distance in astronomical units as well? It’s assumed most of us think Earth is always at exactly 1 AU (astronomical unit) from the sun, but we’re not. We have an elliptical orbit, and so get nearer to the sun in January than in July. That shifts the irradiance hitting top of our atmosphere by almost five percent across the year. This can be important if you want to model systems precisely. Particularly when operating in high latitudes where seasonal effects is strong.
The page has a handy reference table explaining it all: how much more Venus is getting fried by proximity, while Mars is stuck with receiving way less because it’s so much further away. On Earth, it’s subtle, but it does add up.
You can also look at the issue of daily energy. Energy (in kilowatt-hours) is a volume; irradiance (measured in watts per square meter) is a rate. You use the former to get from one to the other: Multiply the rate (irradiance) by how long the sun shine effectively (how many hours). That’s when the concept of peak sun hours comes into play. It doesn’t refer to the number of total daylight hours. Instead, it refers to how many hours the sun would of had to shine at its strongest level to produce the same amount of energy as the actual, changing sun does on any given day. On a cloudy day, you may have twelve hours of daylight, but only three hours of peak sun. And that makes all the difference when estimating for grid tie or when figuring out what size batteries to buy.
A typical pitfall with these instruments is that users misinterpret the lit-up area. With a partially shaded sensor or panel, you get less power readout, but actual covered area isn’t changed. So the reading for irradiance will be too low because you’re dividing by total area rather than just the part actually lit. Always measure the area that’s under the light source. It sounds silly, but this is something to watch out for during field testing.
You can then see how much of that measured power compares to adjusted theoretical sunlight. Use that to find where the loss in the system is coming from. Is your measured irradiance way less than the adjusted theoretical? Then there’s a problem. Perhaps the angle is incorrect or perhaps your panels is dirty. Perhaps the clearness factor was not correctly set to match the actual sky conditions. Knowing what you’re getting compared to what the sun should be giving you begins the troubleshooting process.
So in a nutshell, that’s what solar energy is, harvesting a changing resource. Solar moves; weather alters; geometry varies. You plug in your variables and go from guesswork to knowledge. You factor in distance, tilt and the haze. It is not simply about what the day appears to be. It’s about what power actualy reaches the glass.