Solar Energy Received Calculator
Estimate collected solar energy from irradiance, active area, exposure time, incidence angle, panel efficiency, and system losses.
☀️Real solar presets
📐Solar input details
Solar energy estimate
🗂Comparison grid
🧮Formula breakdown
📊Solar reference tables
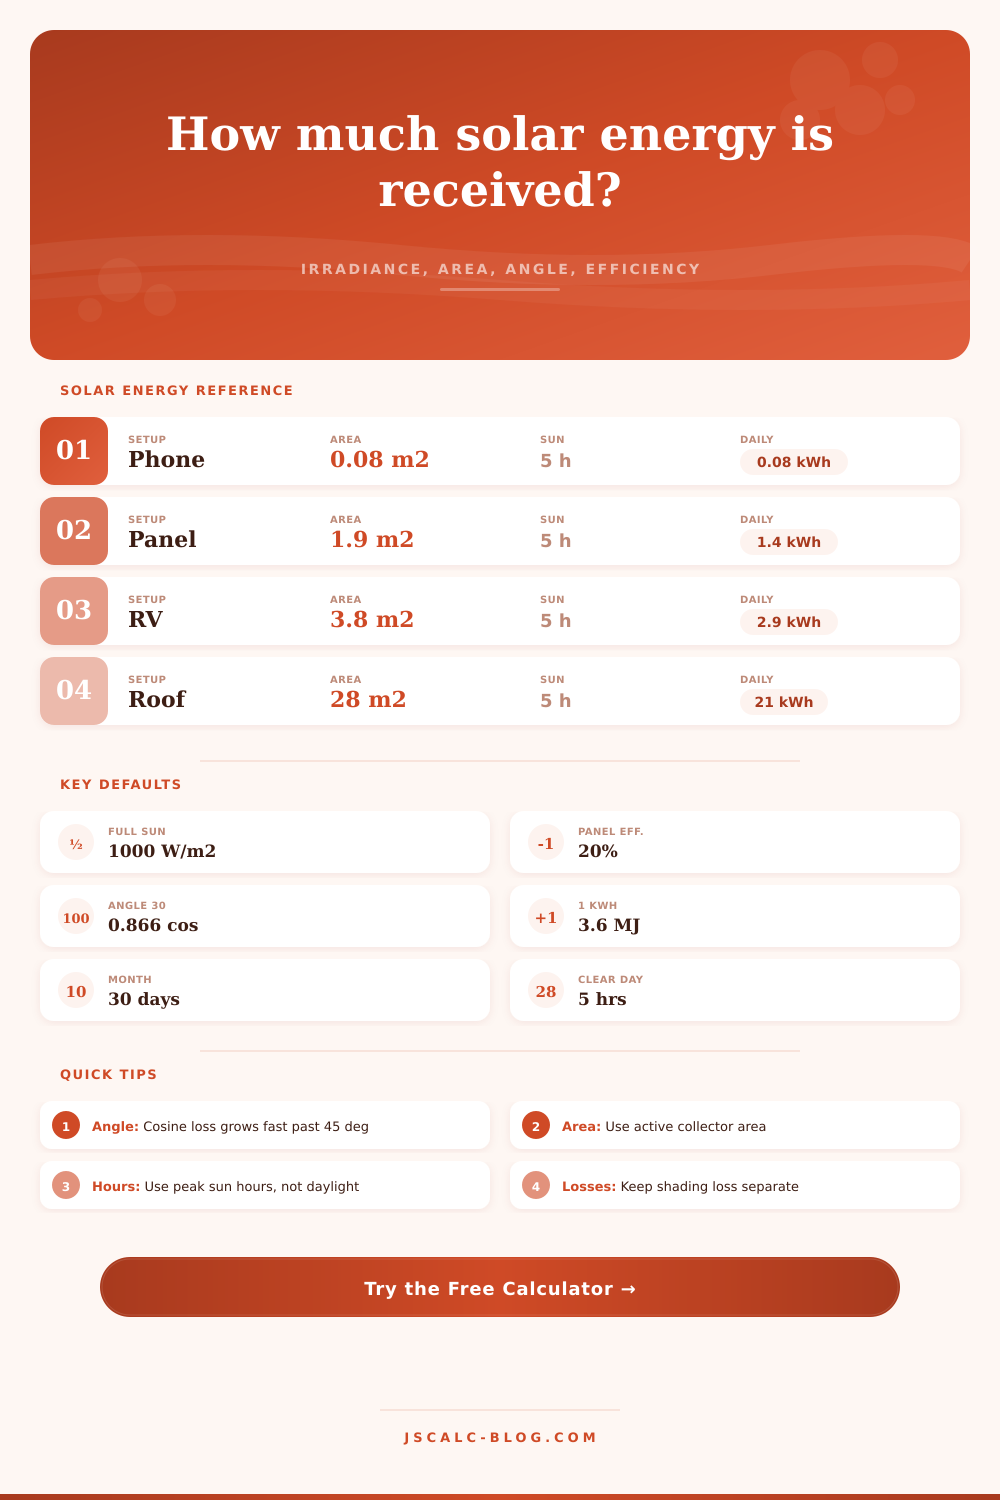
Use these lookup values to choose realistic inputs before calculating.
| Solar condition | Typical irradiance | Use case | Input note |
|---|---|---|---|
| Standard test condition | 1000 W/m² | Panel rating comparison | Lab-style rating |
| Clear direct sun | 850 to 1000 W/m² | Midday PV estimate | Best real sun |
| Average useful sun | 650 to 800 W/m² | Daily planning | Good default |
| Hazy or light cloud | 350 to 600 W/m² | Mixed sky | Lower output |
| Bright overcast | 100 to 250 W/m² | Cloudy collection | Diffuse light |
| Low winter sun | 250 to 500 W/m² | Short days or low sun | Angle matters |
| Panel or system example | Active area | Efficiency | Approx rating at 1000 W/m² |
|---|---|---|---|
| Small USB solar charger | 0.06 to 0.12 m² | 15% to 22% | 9 to 26 W |
| Portable folding panel | 0.45 to 0.65 m² | 18% to 23% | 80 to 150 W |
| Modern residential panel | 1.85 to 2.10 m² | 19% to 23% | 350 to 480 W |
| Two-panel RV kit | 3.7 to 4.2 m² | 19% to 22% | 700 to 920 W |
| Balcony micro system | 3.5 to 5.0 m² | 18% to 22% | 650 to 1100 W |
| 6 kW home roof array | 27 to 32 m² | 19% to 22% | 5.1 to 7.0 kW |
| Incidence angle | Cosine factor | Collected share | Meaning |
|---|---|---|---|
| 0° | 1.000 | 100% | Sunlight square-on |
| 15° | 0.966 | 96.6% | Small angle loss |
| 30° | 0.866 | 86.6% | Common tilt mismatch |
| 45° | 0.707 | 70.7% | Large oblique sun |
| 60° | 0.500 | 50.0% | Half geometric input |
| 75° | 0.259 | 25.9% | Very low sun angle |
| Energy value | Wh | kWh | MJ |
|---|---|---|---|
| Small device charge | 50 Wh | 0.05 kWh | 0.18 MJ |
| Portable panel day | 500 Wh | 0.50 kWh | 1.80 MJ |
| Single panel day | 1400 Wh | 1.40 kWh | 5.04 MJ |
| RV panel day | 3000 Wh | 3.00 kWh | 10.80 MJ |
| Home roof day | 24000 Wh | 24.00 kWh | 86.40 MJ |
| Home roof month | 720000 Wh | 720 kWh | 2592 MJ |
💡Calculation tips
At some point, you probably read the spec sheet on a solar panel and saw a big number in watts. It could be a six hundred-watt solar panel or a four hundred-watt solar panel. And you thought: Okay, so it’ll make that many watt each hour of every day.
Nope. That’s what it says on the spec sheet because that’s what it produces when tested in lab conditions, with everything held exactly right. In real life? Messy. The clouds move; the sun moves; dust collects on glass. Your roof isn’t exactly square to the sky.
How Solar Panels Actually Work
The calculator, above, will do the math for you, but knowing which numbers goes into the calculation… And why they matter, is where the value lies. So, how does it work?
First off, you need to know what you’re measuring. Sunlight that reaches your surface is called irradiance. A thousand watts per square meter is considered normal and used as a standard in test conditions. Panels is rated using this level. But you may be getting only six hundred from midday sun on a hazy day. Rather than guessing at what the real-world situation will be, the calculator lets you select realistic conditions.
Pick peak sun hours different than daylight hours. If you have five peak sun hours, then you’ll recieve as much energy as if you had five hour of that full one thousand watt standard. It’s a condensing of the day’s output into one useful number.
And then there’s the angle. That’s where most people mess up. When the sun’s hitting the panel directly, it’s getting full energy. If it’s hitting at an angle, the same amount of energy are spreading across a bigger area and thus isn’t as intense. It’s a geometric fact of life dictated by cosine function.
So when you’re at 30 degrees off-center, you lose roughly one-third (thirteen percent) of potential input. When you’re at 45 degrees, you’re down to 70 percent. Fortunately, the calculator will do all this for you, but what you should of understand is that your roof tilt has more impact than you realize. In the dead of winter, a flat roof panel could well have its surface angled steeply toward the sun and lose a lot of power before the cells begins turning it into electricity.
The other variable is efficiency. That sounds easy enough but contains its own complexities. Twenty percent efficiency means the panel converts twenty percent of whatever hits it into electricity. Anything else is either lost (as heat) or reflected back out. It is not magic, and today’s panels is improving.
Then there are system losses. Shading, dirt, wiring resistance, inverter inefficiency, they’ll all diminish the ultimate result. These losses is typically about ten to fifteen percent for a clean, well-wired system, though this is accounted for in tool’s loss field. Ignore it and you’re setting yourself up for over-optimistic expectations.
But why bother with all this? Why size a system? Well, it is for reliability. Knowing what it’s capable of at its peak matter less than knowing what it will do under its worst case conditions.
Are you using a portable solar charger on your backpack? You won’t get enough power to run a laptop in full shade. Does your house have a glass roof? It will handle much heavier load.
What I’m trying to show on the page is that there is a combination of two things (area + efficiency) which translates into real world output. And it helps you visualize if you has enough space to really make it work out for your energy needs.
What are the trade-offs? With smaller efficiency, you get more area. With better angle, you minimize cosine losses. With cleaner panels, you minimize system losses. There’s a cost to each of those levers.
A solar tracking system (which follows the sun) is expensive. Bigger panels mean more mounting hardware. That calculator lets you play out all those scenarios without purchase. It turns complex physics into real kilowatt hours.
Solar is free, right? Well… yes and no. Solar is free, but collecting it is an engineering problem. The sun doesn’t give a hoot whether or not your battery is charged up. It gives what it gives. You have to collect as much as you can and then waste as little as you can.
When you look beyond wattage on a sticker and begin measuring the daily harvest, that’s when the math make sense. Then you realize this isn’t really a power generation device, but instead a collection bucket. And that changes everything. That’s where informed ownership begins and frustrated use ends. What you catch is what you get.