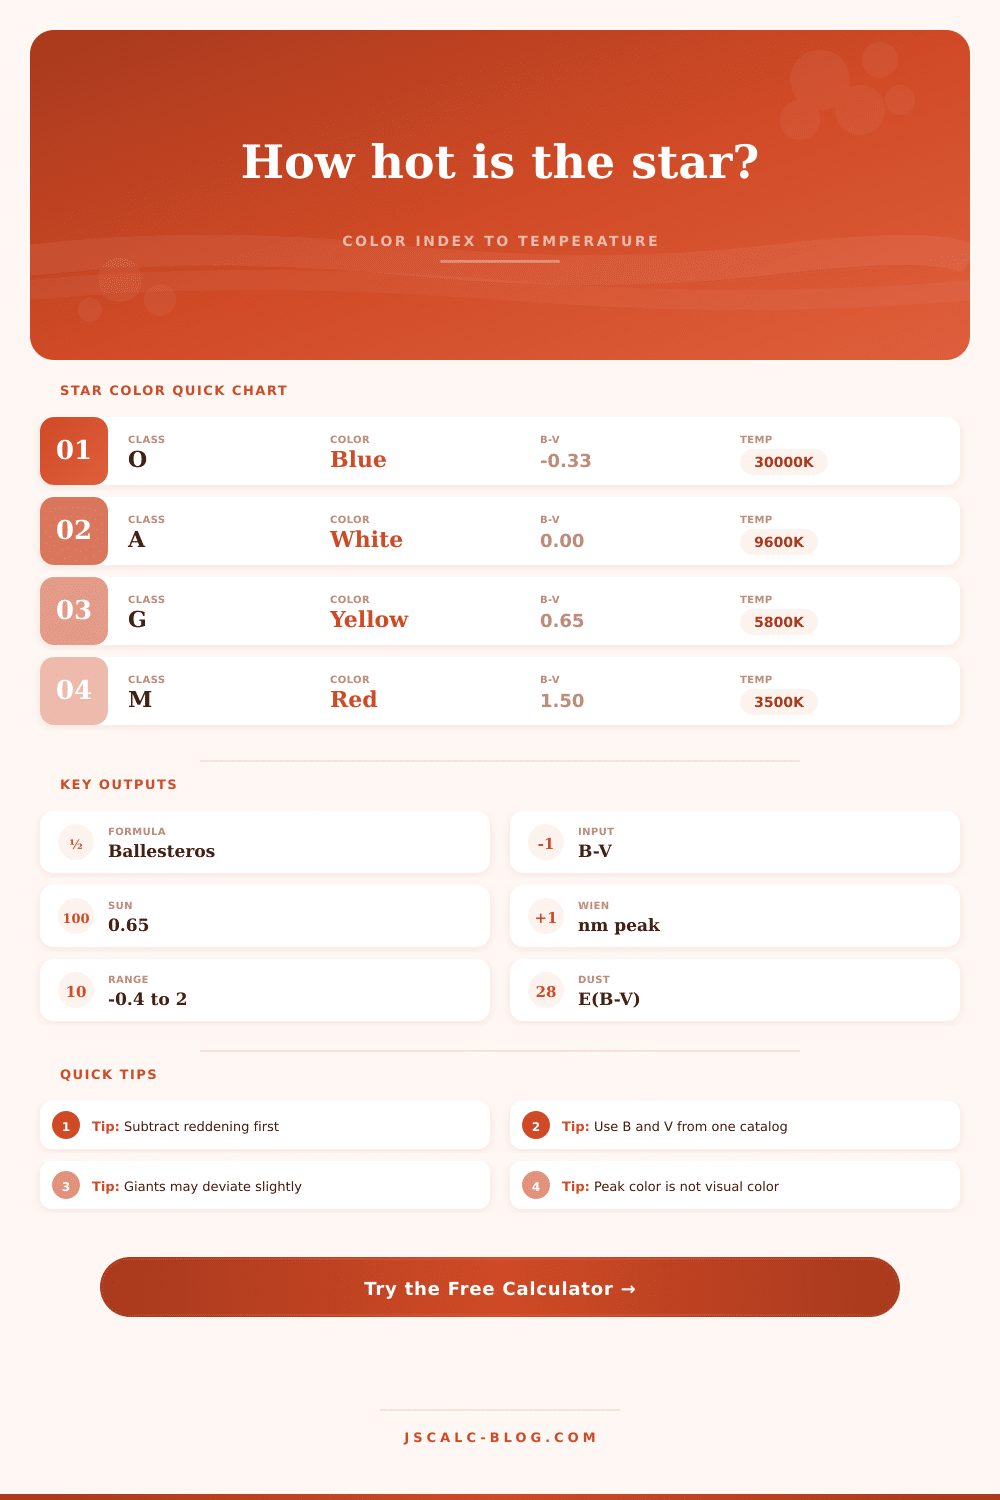
Star Temperature From Color Calculator
Estimate a star's effective temperature from B-V color index with the Ballesteros approximation, dereddening, spectral class, color reference, and optional Wien peak wavelength.
| Class | Typical Color | Temperature Range | Approx B-V Range | Example |
|---|---|---|---|---|
| O | Blue | 30,000 K and hotter | -0.40 to -0.30 | Zeta Puppis scale |
| B | Blue-white | 10,000 to 30,000 K | -0.30 to -0.02 | Rigel, Spica |
| A | White | 7,500 to 10,000 K | -0.02 to 0.30 | Sirius A, Vega |
| F | Yellow-white | 6,000 to 7,500 K | 0.30 to 0.58 | Procyon A |
| G | Yellow | 5,200 to 6,000 K | 0.58 to 0.81 | Sun, Capella |
| K | Orange | 3,700 to 5,200 K | 0.81 to 1.40 | Arcturus |
| M | Red-orange | Under 3,700 K | 1.40 to 2.00+ | Proxima, Betelgeuse |
| B-V | Ballesteros Temp | Likely Class | Peak Wavelength | Visual Color Note |
|---|---|---|---|---|
| -0.33 | 17,830 K | B | 162 nm | Blue-white, UV-heavy |
| -0.17 | 12,900 K | B | 225 nm | Blue-white |
| 0.00 | 10,100 K | A | 287 nm | White with blue tint |
| 0.32 | 7,300 K | F | 397 nm | White to yellow-white |
| 0.65 | 5,780 K | G | 501 nm | Yellow-white to yellow |
| 1.00 | 4,740 K | K | 612 nm | Orange |
| 1.50 | 3,790 K | M | 765 nm | Red-orange |
| 1.85 | 3,330 K | M | 869 nm | Deep red visual |
| Observed B-V | E(B-V) | Corrected B-V | Temperature Shift | Use Case |
|---|---|---|---|---|
| 0.65 | 0.00 | 0.65 | No correction | Nearby solar-type star |
| 0.75 | 0.10 | 0.65 | Warmer after dust removal | Modest interstellar reddening |
| 0.20 | 0.05 | 0.15 | Hotter by several hundred K | Blue-white field star |
| 1.40 | 0.20 | 1.20 | Moves from red toward orange | Dusty red giant sightline |
| -0.10 | 0.15 | -0.25 | Much hotter blue star | Early-type star in a cluster |
| 1.80 | 0.00 | 1.80 | Very cool estimate | Late M dwarf or supergiant |
The night sky looks black, with one big blotch of red in it. And the red looks familiar. It’s like the red of a ripe apple or maybe a stoplight.
But no: it’s way more intense than that. Because what you’re seeing isn’t just a splash of paint; it’s an actual measure of how energetic this thing is. No, the star isn’t just glowing. It’s pouring out heat, and at such a temperature that steel would turn instently into gas.
How to find a star’s temperature from its color
There’s no way for you to get there and stick a thermometer on the surface. Or even a probe sent down into photosphere. You have to use light. More specifically, you must observe how much yellowish white light hits your eye, and compare it to how much bluish light gets here. The latter, minus the former, gives you so-called color index, which lets you unlock the star’s thermal state.
By transforming that easy color change into a useful temperature, this thing does all the work. What I do on this page is provide B-V value. That’s how much the object is blue compared to its visual light. That value gets run through the Ballesteros approximation, a nifty little mathematical dodge. It takes the correlation between color and temperature for ordinary stars, and it fits a curve to it. It bypasses complicated atmospheric calculations. It also works pretty well for most main-sequence thing out there. Mostly that’s because you know what to feed it. You provide the star’s true color, not the color it has when it finally reaches your telescope after traveling through interstellar dust.
But there’s one silent astronomical thief, and his name is dust. Dust tends to scatter blue wavelengths of light more than other wavelengths. This is called reddening. It makes stars appear cooler than they really are. If a cloud of interstellar dust happens to be between us and a star, then even though the star may be intrinsically white, we see it at Earth as yellow.
The calculator lets you account for this reddening. If you know the E(B-V) value, plug it into the calculator. This removes the reddening from color index, returning it to what it was before being hidden by the dust. Otherwise, you’ll underestimate the temperature of the star, and by a little bit. A very slight change in that color index can mean the difference between an F-type and a G-type star.
Now we have a clean color, and the math shows us its spectral class. If it’s a red star, it’s probably an M star. It is red and pretty darned cool. If it’s blue, then it’s either an O or B star. They are blisteringly hot and burn through their fuel rapidly.
Where along this scale did your star fall?
What’s the Wien peak wavelength of your star? This is the wavelength of the color where the star emit its highest amount of energy. For the Sun (like ours), the Wien peak falls within the visible range. So you see it, it looks like a yellow-white object to you.
For hotter stars, the Wien peak shifts into the ultraviolet. Yes, they appear white or blue to your eye as well, though. But the reason is that they’re still putting out a lot of light in the visible, even if their real center of power lies beyond what your eyes can see. And that is where many people gets it wrong. Peak emission doesn’t necessarily equal visual color.
You can compare it to other stars. For instance, the Sun’s temp is about 5780 Kelvin and its color index is roughly 0.65. So if your star has a lower index then it must be hotter. And if it has a higher one then it must be cooler. The tool will show you where you rank relative to that standard. That puts some context on the raw number.
You know what? 10,000 Kelvin is an abstract temperature. Twice the heat of the Sun makes it concrete.
It accounts for uncertainty. Want a fuzzy measurement? It’ll give you a range. This is honest science. There are no single exact answers in astronomy. Mostly it’s ranges and probabilities.
Try out the presets and compare the stars to see who stacks up. Betelgeuse? Deep red. Surprisingly cool for such a giant. Rigel? Blue-white. Much hotter, even though they’re both in the same constellation. These comparisons shows how different stars can be.
And they point out where the formula falls short. Stars with strong emission lines or highly odd stars might not line up quite so well on the curve. In those cases, you need to use spectroscopy. But for all others, this is a reliable color-to-temperature link. It takes what the eye sees, a splash of light… And transforms it into something else: data.
A look up in the sky becomes a measurement, a fact.
Next time you look at a red star, remember that you are looking at something cooler than most things in a really hot universe. Read the story from its color.