Main Sequence Lifetime Calculator
Estimate a hydrogen-burning star's main-sequence lifetime from mass and luminosity, compare it with the common mass-luminosity shortcut, and read range caveats before trusting the number.
| Mass range | Approx relation | Lifetime trend | Best caveat |
|---|---|---|---|
| 0.08 to 0.43 Msun | L ≈ 0.23M^2.3 | Very long, often hundreds of Gyr | Fully convective physics makes simple scaling rough |
| 0.43 to 2 Msun | L ≈ M^4 | Solar-like to a few Gyr | Metallicity and age alter the exact track |
| 2 to 20 Msun | L ≈ 1.5M^3.5 | Hundreds to tens of Myr | Mass loss and rotation become important |
| Above 20 Msun | Power law bends | Often only a few Myr | Detailed stellar-evolution models are preferred |
| Off main sequence | Not valid | L no longer traces core hydrogen burning | Do not use dwarf lifetime formulas |
| Preset star | Mass (Msun) | Luminosity (Lsun) | Direct lifetime | Comment |
|---|---|---|---|---|
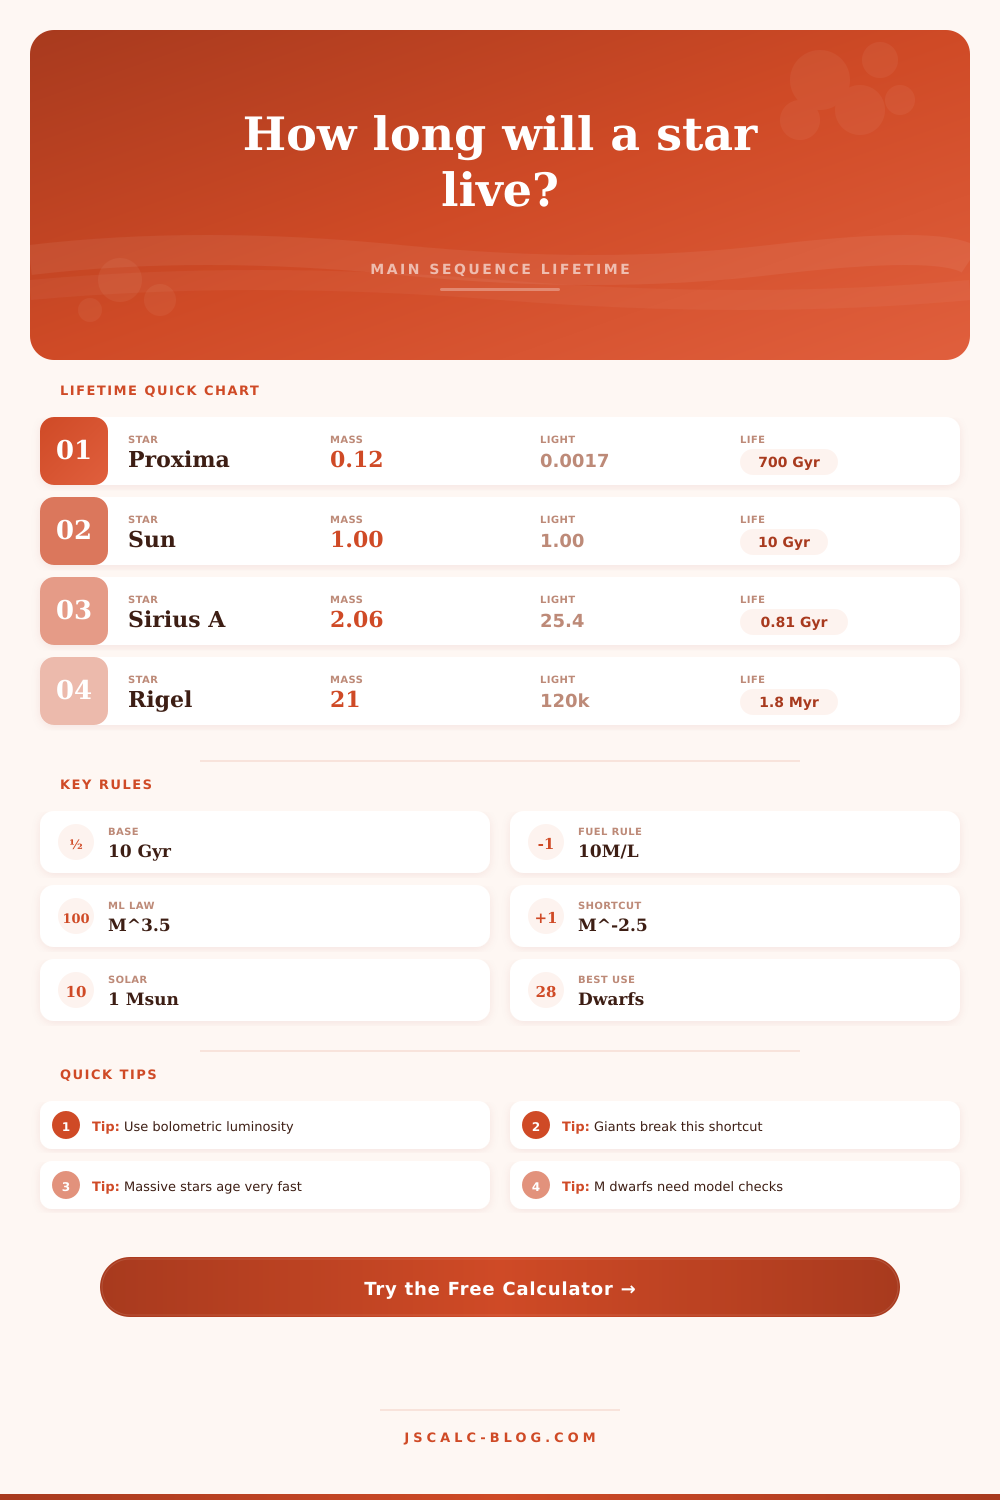
| Proxima Centauri | 0.122 | 0.0017 | About 718 Gyr | Low-mass dwarf; simple result is a broad estimate |
| TRAPPIST-1 | 0.089 | 0.00055 | About 1,618 Gyr | Near the hydrogen-burning lower end |
| Tau Ceti | 0.78 | 0.52 | About 15 Gyr | Old, quiet G-type/K-type boundary star |
| Sun | 1.00 | 1.00 | 10 Gyr | Normalization point for the calculator |
| Sirius A | 2.06 | 25.4 | About 811 Myr | Massive A star with short main-sequence time |
| Spica | 11.4 | 20,500 | About 5.6 Myr | High-mass binary; use caution |
| Mass | L = M^3.5 | t = 10M/L | t = 10M^-2.5 | Scale |
|---|---|---|---|---|
| 0.2 Msun | 0.0036 Lsun | 559 Gyr | 559 Gyr | Red dwarf |
| 0.5 Msun | 0.088 Lsun | 56.6 Gyr | 56.6 Gyr | Cool dwarf |
| 1.0 Msun | 1 Lsun | 10 Gyr | 10 Gyr | Solar |
| 2.0 Msun | 11.3 Lsun | 1.77 Gyr | 1.77 Gyr | A/F star |
| 5.0 Msun | 279.5 Lsun | 179 Myr | 179 Myr | B star |
| 10 Msun | 3,162 Lsun | 31.6 Myr | 31.6 Myr | O/B star |
| Input choice | What it means | When to use | Watch out for |
|---|---|---|---|
| Entered Lsun | Catalog or measured bolometric luminosity | Best direct use of t = 10M/L | Visual luminosity is not the same as bolometric |
| L = M^alpha | One exponent for all masses | Fast teaching examples and rough checks | Low and high mass stars bend away from one exponent |
| Piecewise relation | Low, solar, and high branches | Better rough estimates across a wider mass range | Still approximate near branch edges |
| Mbol | Converts magnitude to luminosity | When absolute bolometric magnitude is known | Requires bolometric, not apparent, magnitude |
But stars are not candles. In fact, they’re exactly opposite. A candle is made from burning it’s own waxy substance. As it gives off light, it dwindles down to nothing.
But what’s inside a star? It is stack of nuclear fuel. Down in its core, it’s slowly fusing Hydrogen into Helium. Think of a star as a slow-motion fireworks display. Some last billions of years; some only millions. Why the difference? Well that depends on rate at which they consume their fuel compared to how much there is to begin with.
How Long Stars Live
You’d think a big star would outlast a little one because it has so much more fuel. Not so. Because it uses that fuel at such high rates, it quickly use up all its reserves. That’s the heart of stellar evolution. And the tool above will calculate that balance for you.
It’s a simple equation: lifetime = fuel/luminosity. What does that mean in practice? Take the mass of the star. Mass is your supply of hydrogen. Divide by luminosity, your burn rate. For our baseline, we turn to the Sun. It has one solar mass and one solar luminosity. On the main sequence, it gets about a ten billion-year lease on life. That isn’t a hard limit. It’s a standard point around which whole system is anchored.
A star with twice the mass of the sun and twenty-five times the luminosity won’t last as long. A star with half the mass of the sun but an eighth the luminosity should of last far longer. The calculator figures that part out for you right away. Play with each variable and watch where the balance tips.
OK, but what about luminosity? That’s where the mass-luminosity relation comes in. In general, luminosity rise rapidly as stellar mass increases (at least for stars like our own). A 2 solar-mass star may have 25 times the luminosity of one solar-mass. Why? Because it contains two times the fuel. And because it burns it at twenty-five times the rate which shortens its life.
The trick lies in the mass luminosity relationship. If you use shortcut mode on the tool, it’s assumed there’s a power law relationship between them. The exponent is typically three and five tenths. This gives us a handy rule-of-thumb for mid-range stars only. It says their lifetime depends on their mass to the minus two and five tenths power. It is not universal, mind you.
But what about lower mass red dwarfs? These are all-convective star. They churn their fuel; they don’t leave any behind in a dead core. And they have much flatter brightness scaling laws (that’s the opposite of the steep curve we’re used to seeing with more massive stars). Not only do they last far longer then this crude approximation, but some models indicates they might be able to burn for hundreds of billions of years. They outlive the age of the entire universe! Plug a Proxima Centauri-type star into the calculator and it show you something that doesn’t make sense on a gut level. It illustrates why your choice of model matters at different masses.
The piecewise option in the tool tries to span the distance. It tweaks the exponent depending on whether mass is very small or very large. The other extreme involves massive stars. They are luminous monsters. They are often tens of thousands of times brighter than the Sun. They have brief, violent lives. Then they die as supernovae. And the calculator will tell you their lives, not in billions but millions of years. That’s because they burn through their fuel quickly. We don’t see many big ones around us because it doesn’t give them time to get very far. When you look at a bright blue star, you are looking at leftovers from when stars was recently born.
The dropdown warning in the tool cautions that you shouldn’t use same dwarf formulas on giants or supergiants. Their internal structure is quite different. No sense using simple fuel-over-luminosity math on them.
Finally, there’s the metallicity of the star to consider. How much do elements beyond hydrogen and helium impact how energy moves through the star and how much light it blocks? For example, a metal-poor star may be hotter and brighter different than a metal-rich star with same mass. That small variation can change the estimated stellar lifespan quite significantly. The tool also has modifiers for this type of scenario. For situations that don’t fall under assumption of standard solar composition, it provides a rough adjuster.
Stars aren’t uniform balls of gas. They’re complicated physical systems that is influenced by their birth environment. This calculator is really just a way into the life spans of the universe’s engines. It is a way to translate the abstractions of physics into real-time. It shows that these numbers tell a story of balance.
Maybe you’d like to know how much longer our very own Sun will last. Or perhaps you have a hankering to learn about the short life span of some giant O-type star. There’s roughly five billion years remaining for the Sun. That leaves plenty of breathing room for the evolution of planets. Long after the Milky Way has collided with Andromeda, there may still be a red dwarf flickering on. Before a giant star even fully forms, it’s half-way to its grave.
Add up the numbers. Understand their implications. We live right now, in the instant between the long flame of the dwarves and the brief flare of the giants. That’s what the equations shows us.