Stellar Mass From Luminosity Calculator
Estimate a main-sequence star's mass from luminosity with low-mass, near-solar, and high-mass power-law relations, then inspect lifetime, radius, and range caveats.
| Branch | Approximate mass span | Luminosity relation | Inverse mass formula | Use with care when |
|---|---|---|---|---|
| Low-mass dwarf | 0.08 to 0.43 Msun | L = 0.23M^2.3 | M = (L / 0.23)^(1 / 2.3) | Very young, metal-poor, or brown-dwarf boundary objects |
| Near-solar dwarf | 0.43 to 2 Msun | L = M^4 | M = L^(1 / 4) | Subgiants, unresolved binaries, or evolved A/F stars |
| High-mass dwarf | 2 to about 55 Msun | L = 1.5M^3.5 | M = (L / 1.5)^(1 / 3.5) | Very massive stars near the Eddington regime |
| Custom power law | User supplied | L = kM^alpha | M = (L / k)^(1 / alpha) | You are fitting a cluster, model grid, or textbook convention |
| Star | Approx L/Lsun | Approx catalog mass | Calculator branch | Interpretation |
|---|---|---|---|---|
| Proxima Centauri | 0.0017 | 0.12 Msun | Low-mass | Useful M dwarf sanity check |
| Barnard's Star | 0.0035 | 0.16 Msun | Low-mass | Nearby red dwarf example |
| Tau Ceti | 0.52 | 0.78 Msun | Near-solar | K/G dwarf, long-lived |
| Sun | 1.00 | 1.00 Msun | Near-solar | Normalization point |
| Sirius A | 25.4 | 2.06 Msun | High-mass | Bright A-type dwarf |
| Vega | 40.1 | 2.14 Msun | High-mass | Rapid rotation can bias simple estimates |
| Rigel | 120000 | 18 to 24 Msun | High-mass | Supergiant; relation is a warning flag |
| Deneb | 196000 | 19 to 23 Msun | High-mass | Supergiant luminosity is not dwarf-like |
| Input type | Formula to L/Lsun | Solar reference | Best use |
|---|---|---|---|
| Solar luminosity | L = entered value | 1 Lsun | Catalog luminosities and model outputs |
| Log luminosity | L = 10^logL | logL = 0 | HR diagrams and stellar tracks |
| Bolometric magnitude | L = 10^((4.74 - Mbol) / 2.5) | Mbol Sun = 4.74 | Absolute magnitude converted over all wavelengths |
| Watts | L = watts / 3.828e26 | Solar luminosity constant | Physics calculations and SI data |
| Mv plus BC | Mbol = Mv + BC, then magnitude formula | BC Sun near -0.07 | Visual magnitudes when a bolometric correction is known |
| Situation | Why the estimate shifts | What to do | Typical warning sign |
|---|---|---|---|
| Giant or supergiant | Radius growth makes luminosity huge for the same mass | Use stellar evolution tracks or spectroscopy | Large radius, low surface gravity |
| White dwarf | Luminosity comes from cooling, not hydrogen burning | Use a white-dwarf mass-radius/cooling model | Small radius with high temperature |
| Unresolved binary | Combined light makes one object look too massive | Separate the components or divide flux | Overluminous point on HR diagram |
| Very massive star | Radiation pressure flattens the simple power law | Treat M above about 55 Msun as rough only | Eddington ratio no longer tiny |
| Pre-main-sequence | Contraction luminosity changes with age | Use age-dependent pre-main-sequence tracks | Young cluster or emission-line object |
| Wrong bandpass | Visual light can miss ultraviolet or infrared flux | Apply bolometric correction before mass | Hot blue or cool red star |
The first thing most people notice when they look at a star is its brightness. But we all know appearances can be deceiving. A massive bloated star burns brightly compared to an equally massive, compact dwarf but a dense white dwarf may only glow faintly even though it contains as much mass as our own Sun.
To combat this confusion, astronomers use something called the mass-luminosity relation, a statistical link between a stars fuel supply and amount of energy emitted. Using this relation, the tool below convert from bolometric luminosity (the amount of energy a star gives off) into an approximate mass, radius and main-sequence lifetime. While simple enough for anyone with a computer to use, learning how it works take a little more insight into physics of stars.
How to Use the Star Mass Calculator
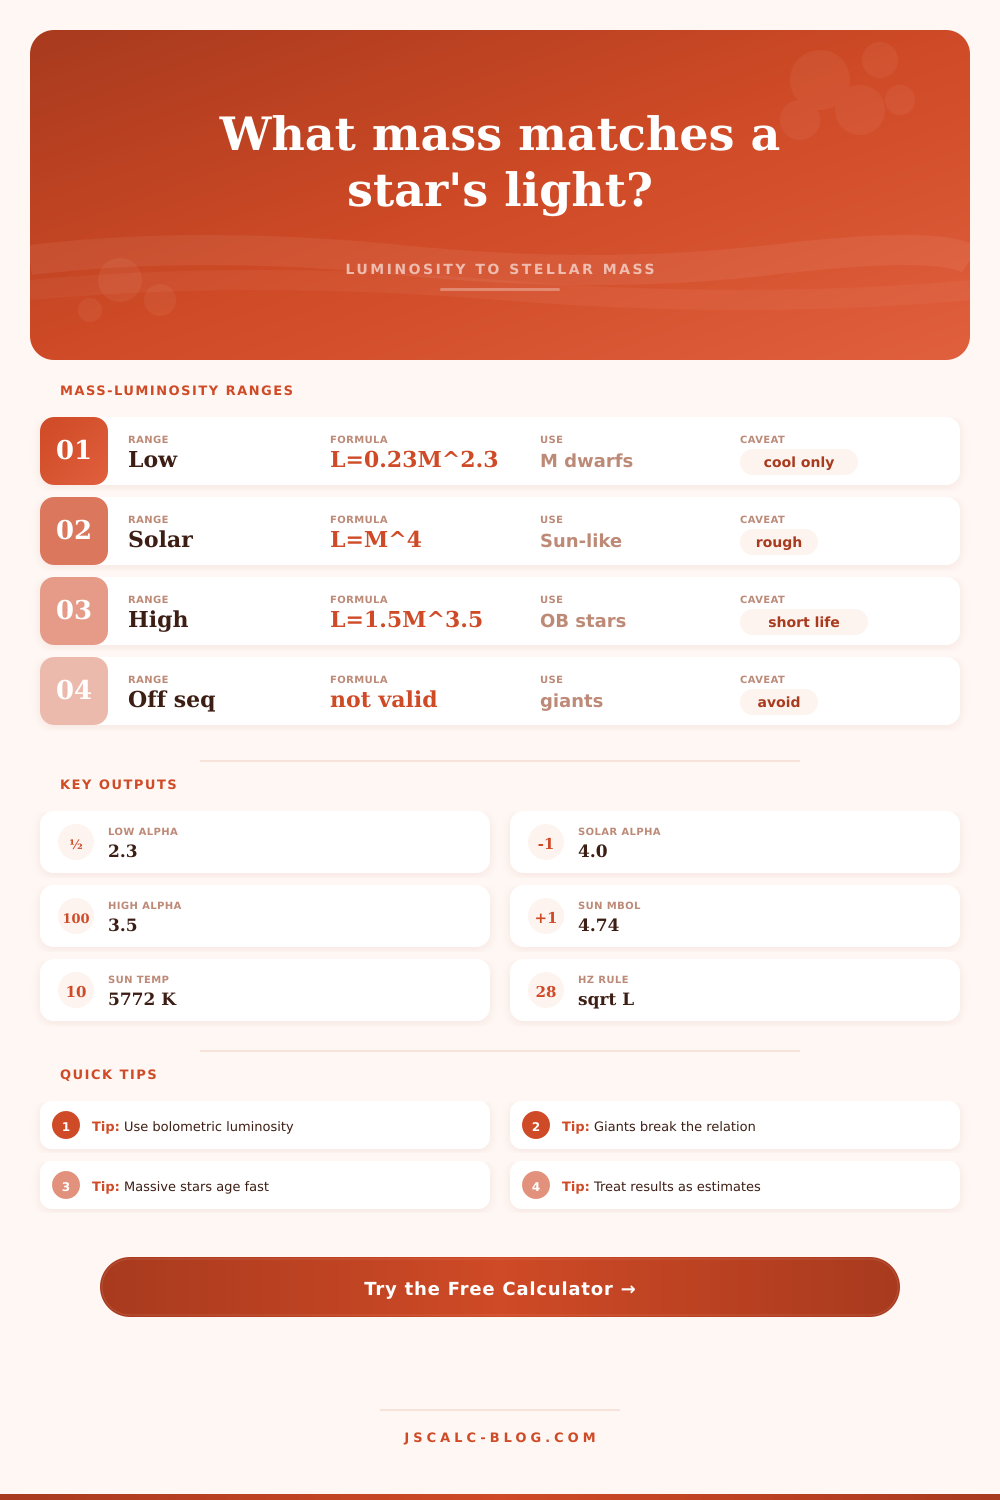
To calculate this, the calculator breaks down stars by their lumen (brightness) into three broad categories: Low Mass Red Dwarfs has a fairly linear relationship, so tiny variations in light output correspond to dramatic changes in measured mass. As you approach the Sun’s level of light, the equation becomes very steep: A little more light mean a much larger amount of mass. Then as you reach the huge Blue Giants, the graph recurs because they’re experiencing such intense radiation and pressure in their cores.
You shouldn’t try to remember these equations; just understand what branch of the equation fits your star. But fortunately, the interface will switch branches automatically for you. Manually selecting a branch let you get an idea of the sensitivity of the outcome to the selected model.
Most people make mistakes when they don’t use the proper input format. The mass-luminosity relation is based off total energy output across all wavelengths, not just what human eyes can see. Are you inputting visual magnitude data of a very hot star? You’re missing out on ultraviolet output. This output dominate its energy output. What happens if you input visual magnitude data for a cool red star? You’re ignoring the infrared glow.
This is why the calculator has a toggle for bolometric corrections, it converts visual data into total power. It makes a huge difference in terms of accuracy. Without it, your mass estimate will be off by a factor of two or more, especially if the object is extremely hot or extremely cold.
There is also more, such as radius and lifetime, which give you some sense of context beyond mass alone. Brighter stars burns through their nuclear fuel far quicker, which is why a star’s lifetime is inversely proportional to its luminosity. This means the smallest, dimmest stars lives for trillions of years, whereas an O-type star can burn out in just a couple million. So the brightest objects up above tend to be the youngest and also most fleeting.
And the other way we know if something has gone wrong is with the radius estimate. If the calculated size doesn’t make any sense for the measured mass and temperature, chances are it’s no longer a star on the main sequence. Supergiants and giants violates these simple power laws. After all, their structures follow a different set of physics than stable, hydrogen-burning dwarfs.
It does that by passing uncertainty along. It provides you not just one hard number, but a range. There’s some error in every measurement we take from Earth because of the distance and interstellar dust. Those percentages decreases when converted into mass (because mass is proportional to the square root of the luminosity). That means a twenty percent uncertainty in the light could be a mere five percent uncertainty in the mass, a nice little assurance that your rough models aren’t going completely wild.
But that mathematical reassurance can’t address systematic uncertainties. If the star turn out to be a binary pair whose light is being merged, no amount of statistical tweaking will rescue the estimate.
This isn’t a replacement for detailed modeling of stars; it’s a connection between theory and observations. It is a calculator that are most useful for main-sequence stars in which fusion balances against internal pressure. Protostars, compact remnants, and other evolved objects is out of its range. Think of this as a rough estimate, a place to start asking more questions, instead of an end-point answer.
The universe does not always fit into clean equations, but these relationships provides a solid roadmap that lets you explore the main sequence of stars. And the art is knowing where to follow the map and where to dig deeper.