Weighted Index Calculator
Calculate Laspeyres, Paasche, Fisher, and weighted average relatives from price, quantity, or share-weighted data.
All formulas still calculate when enough data is present.
Controls displayed index values and table entries.
Enter 6 to 8 comma-separated labels for the basket or segments.
Use expenditure shares, importance weights, or base-period value weights.
Applies only to weighted average relatives.
Weighted index results
| Item | p0 | p1 | q0 | q1 | Price relative | p1q0 | p0q0 | p1q1 | p0q1 |
|---|---|---|---|---|---|---|---|---|---|
| Run the calculator to fill item-level contributions. | |||||||||
| Measure | Formula | Weight base | Best use | Current value |
|---|---|---|---|---|
| Results load after calculation. | ||||
| Situation | Suggested index | Reason | Watch item |
|---|---|---|---|
| Fixed shopping basket | Laspeyres | Uses q0, easy to compare to a base year | May overstate inflation after substitution |
| Current production mix | Paasche | Uses q1, reflects current behavior | Needs current quantities |
| Balanced price index | Fisher | Geometric mean of Laspeyres and Paasche | Requires both q0 and q1 |
| Share-weighted relatives | Weighted average relatives | Uses explicit category weights and price relatives | Weights must match the question |
| Traffic, quality, or rates | Weighted average relatives | Works when values are relatives instead of prices | Avoid mixing units |
| Large substitution shift | Fisher and L-P gap | Shows the midpoint and spread between baskets | Review item shares |
If you’ve ever looked at a price tag only to feel your purchasing power diminish, then you probably understand what I’m talking about. That price is just a number on a tag, but sticker causes heartburn because it represents something real, your money doesn’t go as far as it used to.
Inflation gets reported in the headlines as one percent, two percent, three percent. That’s an abstraction: a number based off thousands of different experiences. Yet your own experience isn’t so generic. Maybe your rent hasn’t changed, yet your food bill soared. Or maybe health insurance premium was unchanged, but your gas bill went through the roof.
Understanding Weighted Indices
How do you put all those various factors together? You need a structured approach, not just a simple average. That’s where weighted indices comes into play. They’re a mathematical tool to explain how much more (or less) it actualy costs to live.
Determining what’s most important to you is the primary difficulty. Each of those budget line item deserves some relative importance. Treating each one identically will distort your perception of your finances. Replacing a roof isn’t equivalent to purchasing a loaf of bread.
Once you’ve quantified your purchases and priced them out, the online calculator (on the page) handles arithmetic for you. There’s no need to change the numbers. The real effort comes beforehand: determining what you’re trying to measure and why you’re measuring it.
Are you interested in how much something costs today, or how much a fixed basket of goods cost from five years prior? That answer will tell you whether to calculate a Paasche or Laspeyres index. Economists have been arguing about this question for more then a hundred years.
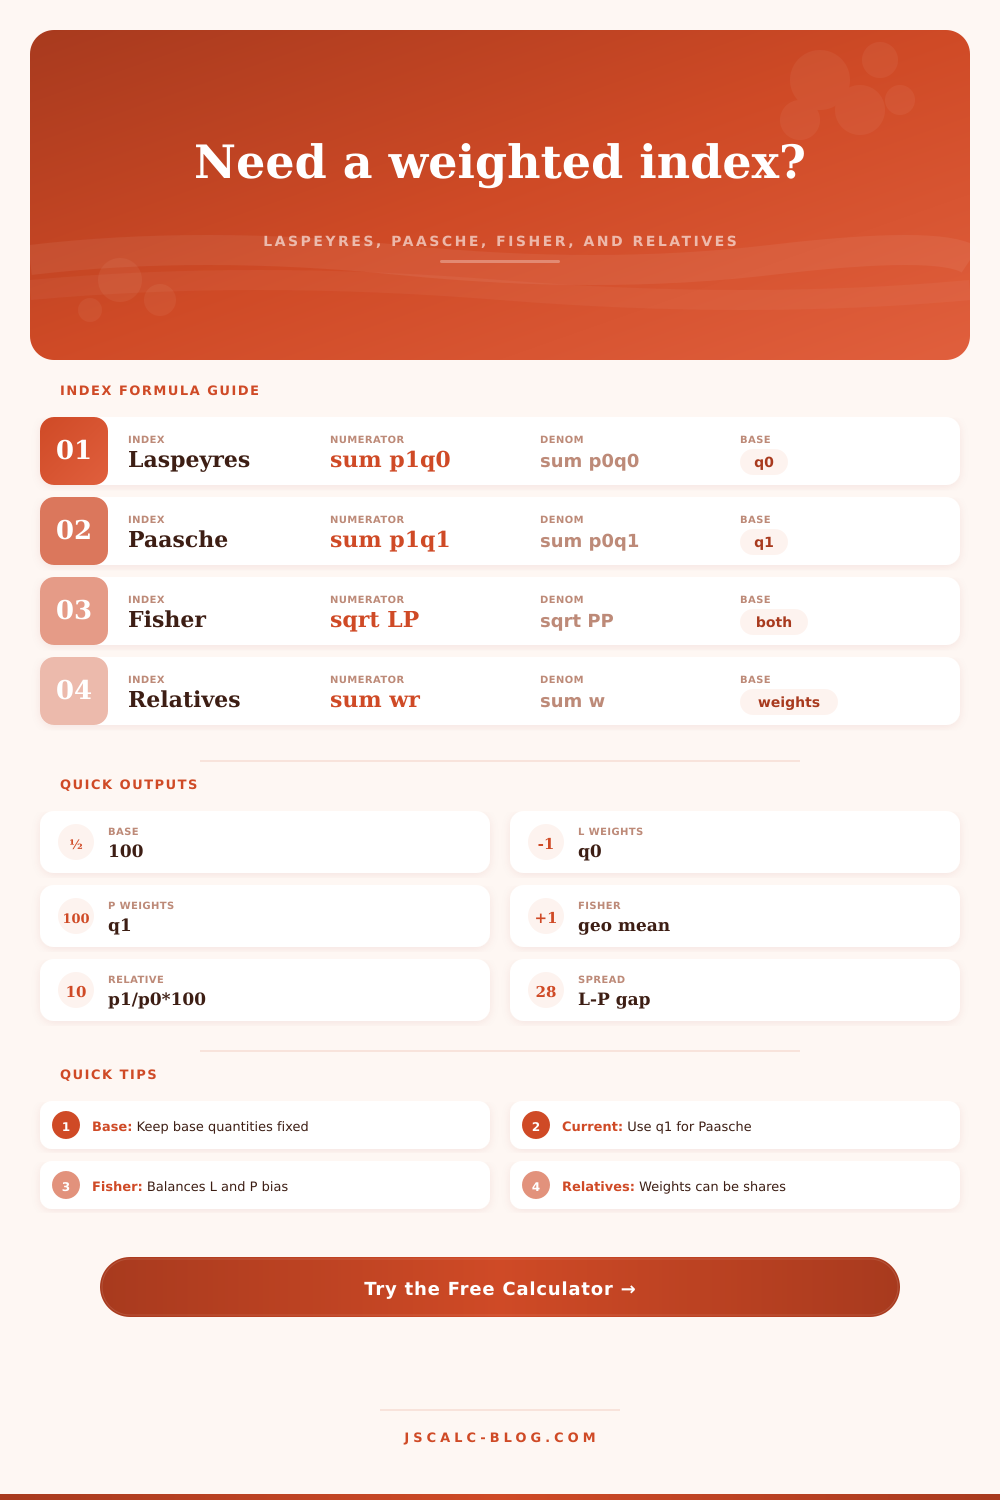
In a Laspeyres index, you weight each quantity with quantities from the base period. This is easy to understand; that’s one reason it’s so common. But there’s a big catch. It presumes you always purchase exact same bundle of goods regardless of price fluctuations. For example, if meat prices rise, maybe you’ll start purchasing some extra chicken. The Laspeyres index doesn’t capture that substitution effect. Instead, it assumes you’re still buying that same amount of beef. This leads to an overstated sense of inflation, since it neglects the tendency to move towards lower-cost items.
Paasche indices solves this problem. Rather than weighting current quantities using quantities from the base period, they weight them using todays quantities. These reflect what you’re actualy doing in terms of purchases at the present moment. Unfortunately, this makes them a moving target: they’re hard to get up-to-date data for, and their results depends on the timing of data collection.
That’s where the Fisher index comes into play. Because the world has changed, we have new habits and an old habit. The Fisher index takes the geometric mean of the two: one half each of the Laspeyres and Paasche indices. The first biases up; the second biases down. It’s not ideal. But it’s a decent compromise. It recognizes that both kinds of basket are relevant.
And indeed, as you can see from the reference table on the page, if there’s been significant substitution activity, the two formulas differ a lot. When they do, pay attention. You’re telling yourself that your basket of goods doesn’t really reflect you anymore, or that consumers is behaving very different than before. Don’t look past that difference. If you drive with blinders on and focus solely on what’s behind you, you might end up crashing.
A second alternative is weighted average relatives. This is especially useful when you aren’t working with raw numbers, but instead with explicit importance weights or shares. For example: maybe you’re measuring website traffic sources by their relative reliability, or the performance of stocks based off portfolio allocation. It is the same idea: you must weight percentages by the size of the groups they come from when calculating an average. That a small niche went up 10% isn’t much good if most of your action was flat.
Switch between types of weight; see what kind of difference your results are sensitive to. Numbers tell a story. Which numbers you use determines that story.
All of this means nothing if you don’t feed the beast consistent information. Choose how you do it, choose how much it matters, then let it go for a while so you can see something happening. Any other comparison is impossible when you change the rules halfway through.
So the calculator spits out some number; that’s its job. What it does and doesn’t include shapes the insight. This brings us back to the most important measurement. It is the question the index helps you ask yourself about the world you’re livig in and how it keeps changing.