Index Number Calculator
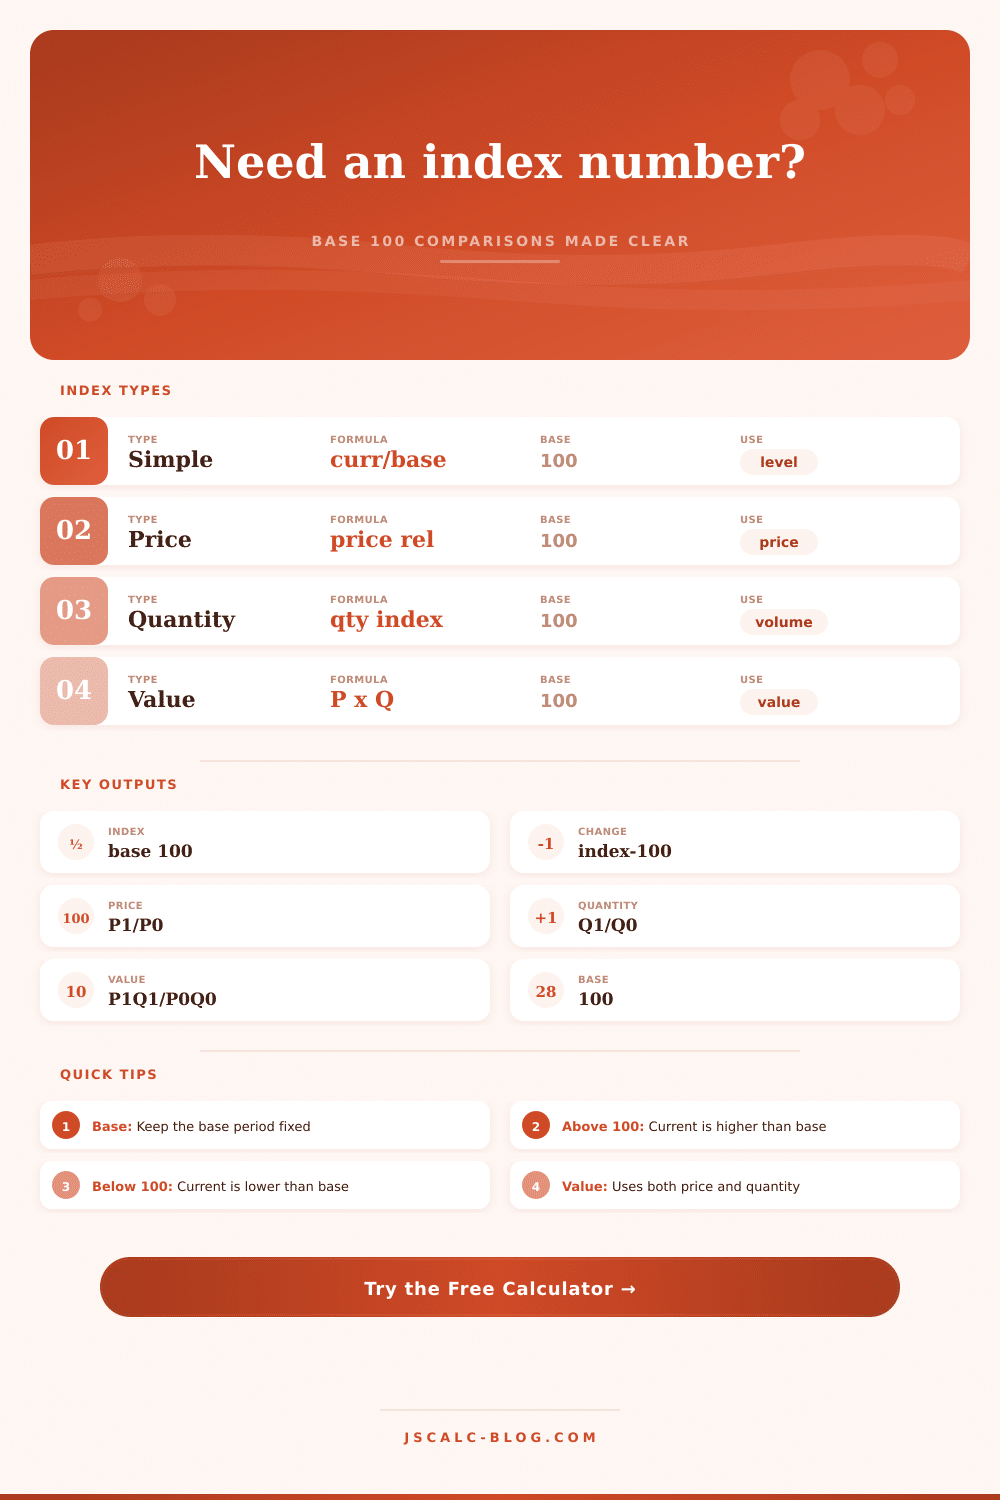
Compute a base-100 simple index, price relative, quantity index, or value index, then read the percent change as index minus 100.
Used directly for simple index mode.
Compared against the base period.
Used for price relative and value index.
Used for quantity and value index.
Index Results
Ready.
| Measure | Base | Current | Index | Percent Change |
|---|
| Index Range | Percent Change | Plain Meaning | Common Use | Check Before Reporting |
|---|---|---|---|---|
| 0 to 49.99 | -100% to -50.01% | Less than half of base | Collapse, shutdown, severe drop | Confirm the same unit and period length |
| 50 to 89.99 | -50% to -10.01% | Well below base | Demand decline or output cut | Check seasonality and sample coverage |
| 90 to 99.99 | -10% to -0.01% | Slightly below base | Small contraction | Round consistently before comparing |
| 100.00 | 0.00% | Equal to base | Reference period | Make the base year or base month clear |
| 100.01 to 110 | 0.01% to 10% | Slightly above base | Modest growth | Use exact source definitions |
| 110.01 to 150 | 10.01% to 50% | Clearly above base | Inflation, growth, expansion | Separate price and quantity effects |
| Above 150 | More than 50% | Far above base | Major expansion or spike | Watch for outliers or changed scope |
| Method | Uses These Inputs | Best For | Core Formula | Main Limitation |
|---|---|---|---|---|
| Simple index | Base value, current value | Single series level | Current / base x 100 | Does not split price and quantity |
| Price relative | Base price, current price | One item price movement | P1 / P0 x 100 | Not a weighted basket index |
| Quantity index | Base quantity, current quantity | Volume or output movement | Q1 / Q0 x 100 | Ignores price changes |
| Value index | Price and quantity pairs | Revenue or expenditure movement | P1Q1 / P0Q0 x 100 | Combines price and quantity effects |
| Percent change | Any computed index | Plain-language reporting | Index - 100 | Needs the base period named |
| Contribution split | Price index and quantity index | Diagnosing value changes | Value index vs components | Single item only in this tool |
Raw numbers can talk right past one another; that’s what usually explains why headlines of high inflation don’t seem to connect with stable grocery bills. Prices are concrete, percentages is abstract, it’s hard for the brain to get them to connect.
That’s where an index number come in: by linking every number to same starting point, it makes chaos become a story of up or down compared to its base period. With an index number, we’re off the hook to worry about doing any math ourselves, just plug in your own numbers into calculator above, and let it do all the heavy lifting.
How to Understand Index Numbers
Without this noise; whether from the size of unit being measured or currency used to pay for it, the base-100 system lets you instantly compare things that would otherwise be incomparable. If index rises to 120, then item has risen by 20%. You don’t have to worry about whether initial item’s price was $10 or $10,000; the base-100 standard make everything comparable.
Companies use it to track how fast their production are growing. As long as everyone uses the same base period, you can compare output of your local steel mill against the output of a national one. It may seem like a minor detail but it goes a huge way towards making things clear.
Without a fixed anchor for comparison, each number float in a vacuum. Trying to analyze trends becomes almost impossible unless you stare at raw spreadsheets all day.
Index Types and Measurement Methods
The type of index you choose determine how the data is being measured once you begin entering numbers in. A straight index will just measure total value… Nothing wrong with that for a snapshot, but there is something going on behind the scenes. The value may have increased due to selling more (or less), the unit prices rising, both or neither.
That’s where the price relative and quantity index comes into play. They break the value apart into two pieces… Volume and price. You can then use these as diagnostic tools and figure out why your finances changed.
For instance if your revenue index was increasing yet your quantity index didn’t move, you raised your prices. Or if you saw an increase in quantity index but no movement in the price relative, you gained market share. Break down numbers and you’ll see exactly what caused the change.
To get full picture, we have combined these two aspects into a single measure: the value index. This is most complete (but also the most unclear) indicator for your bottom-line. When value index goes up, you might find that volume is down, so long as prices spike upwards with sufficient strength to compensate. That’s why you should of also look at the component parts. Is your growth coming from solid volume gains, or are you simply aggressively increasing prices?
On page itself, there’s a handy reference table that explains the interpretation of all value index readings in plain language. If your reading falls between one hundred and one ten, then it indicates a stable, though only moderately positive rate of growth. However, a reading above one hundred and fifty means there is either significant expansion or perhaps an outlier event of some sort.
In some cases people confuse the index with its absolute value. If we report eight hundred, they think metric has crashed, forgetting that the base is set at one thousand. This is where context matter. Always ask yourself: What was the base period? And does it reflect a normal state of affairs?
For example, you’ll get a distorted view by comparing how well we’re doing this year against either an all-time low or, heaven forbid, a once-in-a-lifetime pandemic high. The tool lets you see the change; then you have to make the judgment call: Is base year I selected a reasonable benchmark for our current reality?
And ultimately, an index is simply a lens. It puts some things into sharp focus and others out of focus. One that helps you see how fast and which direction you’re moving, but doesn’t tell you who’s driving.
For that, you have to look down at the road itself: At your operations; at competition; at market itself, to try and grasp what caused those numbers to move as they did. When you get that, the calculator stops being a mere math helper… And instead becomes a telling device.
From there, you no longer are merely reading numbers; you begin to gain insight into path of your investment (or business). And that is where the real value is.
You can crank out the index in seconds. But it takes a little more thinking to interpret it clearley.