CAGR Calculator
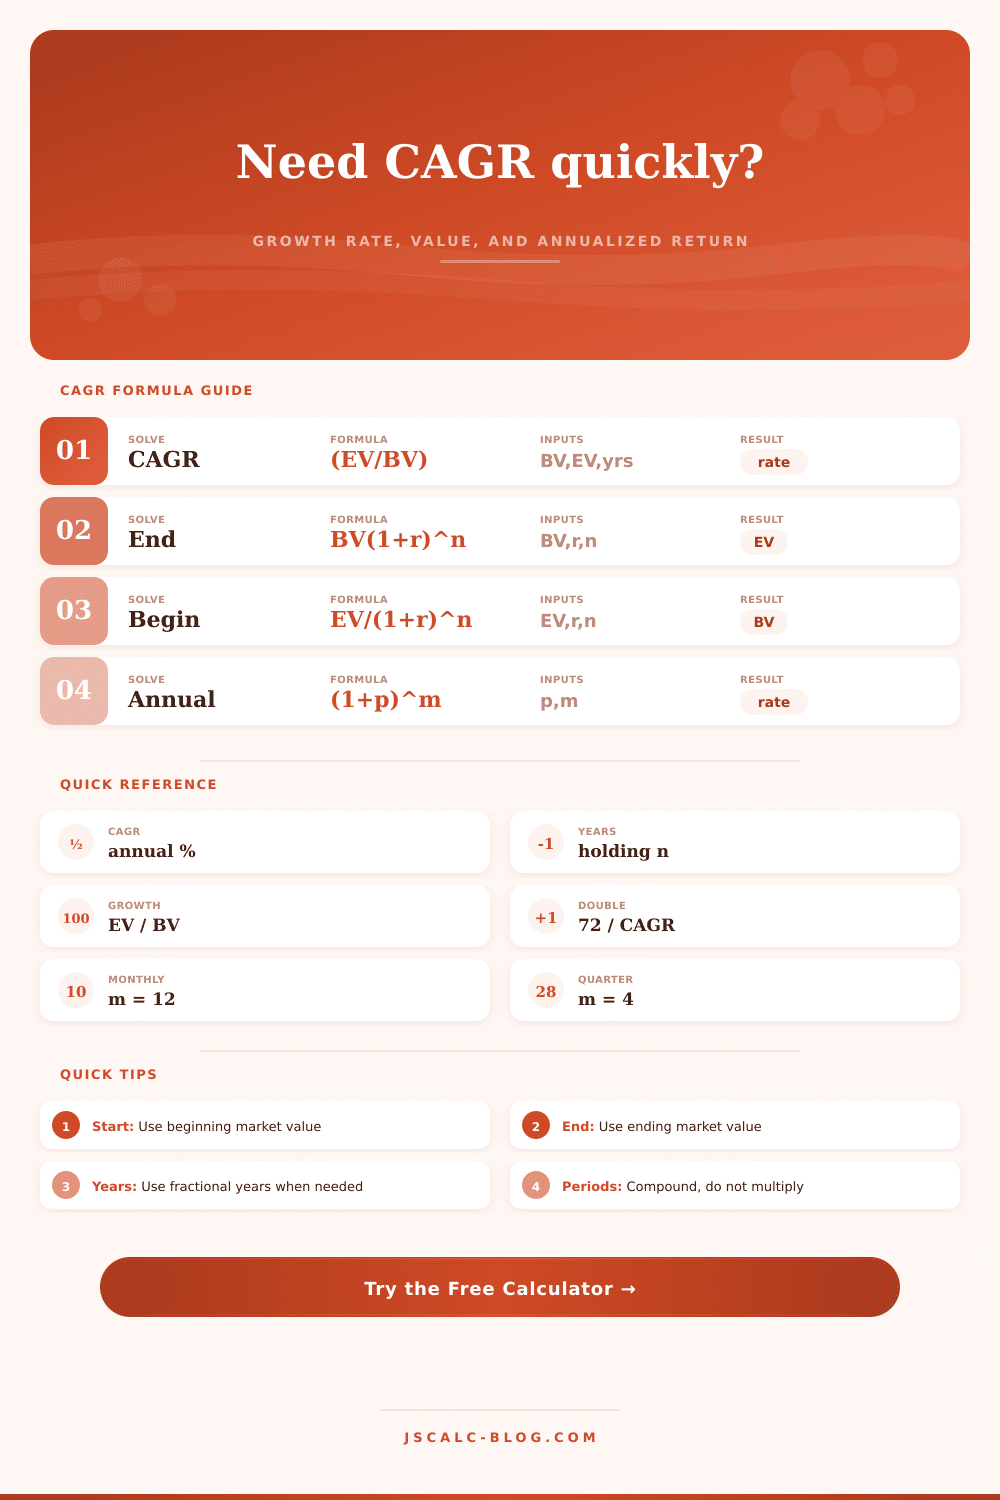
Calculate compound annual growth rate, solve for beginning or ending value, and annualize periodic returns using the standard compounding formulas for investments and business metrics.
🎯Investment And Business Presets
🧮CAGR Inputs
The result cards and formula breakdown update to match this selection.
This labels the interpretation; the math stays compound-growth based.
Starting portfolio value, revenue, users, or other positive base amount.
Final value at the end of the holding or measurement period.
Fractional years are valid, such as 2.5 for two and a half years.
Use 8.5 for 8.5%. Negative rates are allowed above -100%.
For annualizing monthly, quarterly, weekly, or daily compound returns.
Annualized return is (1 + periodic return) raised to periods per year.
Used to show total compound return and equivalent years from periodic data.
Controls percentages, values, and schedule rows.
Formula Breakdown
🔢Current Growth Snapshot
📊Projection Schedule
| Year | Beginning Value | Growth Rate | Growth Amount | Ending Value | Cumulative Return |
|---|---|---|---|---|---|
| Run the calculator to fill the schedule. | |||||
📐Core CAGR Formulas
📈Business And Investment CAGR Context
| Use case | Beginning value | Ending value | Time input | Best interpretation | Common mistake |
|---|---|---|---|---|---|
| Portfolio performance | Starting account value | Ending account value | Holding years | Annualized compound return | Ignoring cash flows |
| Company revenue | First-period revenue | Latest revenue | Fiscal years | Smoothed annual growth | Calling CAGR a forecast |
| SaaS ARR | Initial recurring revenue | Current recurring revenue | Years since start | Run-rate expansion speed | Mixing MRR and ARR units |
| Customer base | Initial active customers | Final active customers | Measurement span | Compounded adoption rate | Ignoring churn mix |
| Real estate equity | Starting equity | Ending equity | Holding period | Equity compounding | Using property value only |
| Profit growth | Initial profit | Final profit | Comparable years | Margin plus scale trend | Using negative starting profit |
| Market size | Base-year TAM | Future-year TAM | Forecast horizon | Market expansion pace | Treating it as guaranteed |
| Periodic returns | Starting amount | Projected ending amount | Number of periods | Annualized compound rate | Multiplying the period rate |
⏱Annualizing Periodic Returns
| Period basis | Periods per year | Example periodic return | Annualized formula | Annualized result |
|---|---|---|---|---|
| Monthly return | 12 | 1.00% | (1.01)^12 - 1 | 12.68% |
| Quarterly return | 4 | 3.00% | (1.03)^4 - 1 | 12.55% |
| Weekly return | 52 | 0.20% | (1.002)^52 - 1 | 10.95% |
| Trading-day return | 252 | 0.04% | (1.0004)^252 - 1 | 10.60% |
| Semiannual return | 2 | 5.00% | (1.05)^2 - 1 | 10.25% |
| Annual return | 1 | 9.00% | (1.09)^1 - 1 | 9.00% |
🧭CAGR Interpretation Bands
| CAGR band | Growth read | Approx double time | Planning note | Watch for |
|---|---|---|---|---|
| Below 0% | Decline | Not applicable | Value is shrinking over time | Recovery math can be steep |
| 0% to 3% | Slow growth | 24+ years | May lag inflation or targets | Small changes may be noise |
| 3% to 7% | Moderate growth | 10 to 24 years | Common for mature assets or metrics | Compare with risk and inflation |
| 7% to 12% | Strong growth | 6 to 10 years | Often meaningful over long horizons | Check sustainability |
| 12% to 25% | High growth | 3 to 6 years | Common in faster business expansion | Base effects matter |
| 25%+ | Hypergrowth | Under 3 years | Rapid compounding from a small base | Can fade as scale rises |
🔍Quick Multiple Lookup
| Growth multiple | Total return | 3-year CAGR | 5-year CAGR | 10-year CAGR | Reading |
|---|---|---|---|---|---|
| 0.50x | -50% | -20.63% | -12.94% | -6.70% | Capital or metric halved |
| 1.25x | 25% | 7.72% | 4.56% | 2.26% | Modest compound growth |
| 1.50x | 50% | 14.47% | 8.45% | 4.14% | Solid multi-year increase |
| 2.00x | 100% | 25.99% | 14.87% | 7.18% | Doubled over the horizon |
| 3.00x | 200% | 44.22% | 24.57% | 11.61% | Large expansion or return |
| 5.00x | 400% | 70.99% | 37.97% | 17.46% | Venture-style multiple |
| 10.00x | 900% | 115.44% | 58.49% | 25.89% | Extreme growth outcome |
💡CAGR Calculation Tips
On a spreadsheet, simple averages may appear great, but they ring hollow when you’re living them. A stock might increase 20% one year, then decline 10% the following year. According to arithmetic average, you enjoyed a five-percent return. But what does your wallet say? Your wallet says that you lost money. Losses is more painful than gains are rewarding. The money is gone.
That’s where compound annual growth rate (CAGR) comes into play. CAGR smooths out volatility to present you with the true annualized rate at which your business or wealth has grown. To put it another way, it reveals the true path underneath the chaos. The calculator above will do the math for you, stripping away noise to show you steady path underneath.
Why CAGR Is Better Than Simple Average
And here’s where most folks go wrong with CAGR: They think it’s a prediction. It’s not. It’s a measure of the past. Given a beginning and end value, it asks what constant rate would of transformed one into the other. That’s important when comparing assets held over different lengths of time. Twenty percent growth over two years is radically dissimilar to twenty percent growth over twenty years. The time frame are the key component doing all the work. If you don’t adjust for time, then you’re simply comparing apples (or whatever) to oranges (or whatever).
Investors aren’t the only ones who use this metric; business people does too. If you’re a startup founder and you’ve grown your revenue from one hundred thousand to five hundred thousand over three years, that sounds like a lot of money. But how strong was the growth engine? Here’s where the CAGR come in. Small numbers tend to have high CAGRs, which is why we often see early-stage companies with high CAGRs. It’s easy to double a small number compared to a billion.
The page includes a table showing how a growth multiple turns into an annual rate. So you’ll notice that a five-fold increase feels different if it happened in ten years versus three. The rate shrinks as the timeline stretch. We have a little trick when it comes to time. We tend to round our year into full numbers, when in fact precision counts. If you owned something for 30 months, that’s two and a half years. Not three. Two underestimates your return while three overestimates it. It is a slight discrepancy, but compounding turns small differences into huge shifts in the results. It is a small but relevant point. You want to know exactly how much time has passed so you can accurately gauge efficiency. This applies particular to fractional units, whether you’re doing quarterly business reviews or trading.
Another common mistake is failing to consider cash flows. The CAGR calculation assume a closed system. It’s focused solely on the beginning and the end. In reality, you may have contributed thousands of dollars to your portfolio throughout the year, which distorts simple CAGR. It doesn’t know when (or even if) you made these contributions. This is why being able to solve for other variables is useful. The calculator allows you to work backwards to calculate starting capital needed to achieve a certain goal. It also lets you project what ending value would result at a desired rate. This shifts the mind-set from looking back to planning ahead, it turns a historical metric into a strategic tool.
Annualizing has particular value for short-term traders. “One percent a month doesn’t sound like much.” Yes, but compounded twelve times, it becomes much more impressive than a flat 12% per year. Compounding accelerates gains in good times and accelerates losses in bad times. That’s how you get a runaway result. The tool handles the exponential math so you don’t have to wrestle with exponents. Annualizing does hard work of the math for you. It takes your periodic investment return and turns it into its annualized equivalent… Allowing you to easily compare a once-a-year bond to a monthly fund.
CAGR is all about perspective. It’s a summary of what has been a complicated journey into one number. It doesn’t describe the luck, nor long hours and sleepless nights during market crashes. It simply describes the rate at which it move. And knowing that rate allows you to determine whether or not you want to remain on the ride. Whether or not you should get off.
How sensitive are your goals? What happens if you change length of time? What happens if you change the rate of return? Tweaking your inputs and seeing the impact lets you decide. It lets you make decisions with numbers instead of vague feelings of momentum. Ultimately, that’s why we do the math, to really know the pace of our own business or financial growth. To have that clarity makes the work of doing the math right worthwild.