Percent Error Calculator
Compare a measured or experimental value with an accepted true value to calculate standard percent error, signed percent error, absolute error, relative error, uncertainty ratio, and clear formula steps.
🎯Measurement Presets
🧮Percent Error Inputs
Context changes the interpretation language, not the formulas.
Name the measured quantity, such as density, voltage, mass, or diameter.
Your observed value before comparison.
The reference value used as the denominator for percent error.
Optional absolute uncertainty in the same unit as the value.
Used only for display, so keep measured and accepted values in this unit.
Most science classes use measured minus true for signed bias.
Calculations use full precision; this only controls display rounding.
🔢Current Error Snapshot
📐Formula Breakdown
📋Preset Comparison Table
| Scenario | Measured | Accepted | Unit | Std % Error | Signed Bias | Reading |
|---|---|---|---|---|---|---|
| Copper density lab | 8.78 | 8.96 | g/cm^3 | 2.01% | Low | Small lab gap |
| Free-fall gravity | 9.64 | 9.80665 | m/s^2 | 1.70% | Low | Good classroom trial |
| Calibration mass check | 49.982 | 50.000 | g | 0.04% | Low | Tight calibration result |
| Thermometer ice bath | 0.38 | 0.00 | °C | N/A | N/A | Use absolute error at zero |
| Machined pin diameter | 10.016 | 10.000 | mm | 0.16% | High | Check tolerance band |
| Voltage reference test | 2.493 | 2.500 | V | 0.28% | Low | Typical meter audit |
| Soil moisture probe | 23.8 | 25.4 | % VWC | 6.30% | Low | Field sensor drift |
| Spectrometer peak | 533.4 | 532.0 | nm | 0.26% | High | Small wavelength offset |
| Flow meter audit | 15.72 | 15.00 | L/min | 4.80% | High | May need recalibration |
🧭Percent Error Interpretation Bands
| Standard Percent Error | Typical Label | Measurement Setting | What To Check | Reporting Note |
|---|---|---|---|---|
| 0% to 0.1% | Very tight | Calibration weights, voltage references, precision machining | Instrument resolution and rounding | Include enough decimal places |
| 0.1% to 1% | Strong | Well-controlled lab or calibrated sensor | Temperature, drift, reference certificate | Usually acceptable for careful work |
| 1% to 5% | Moderate | Student labs, field instruments, quick trials | Technique, calibration, sample prep | Explain likely systematic error |
| 5% to 10% | Large | Field estimates, rough measurements, low-cost probes | Method mismatch or environment effects | Use caution in conclusions |
| Above 10% | Very large | Outlier, wrong unit, bad setup, nonmatching reference | Unit conversion and accepted value choice | Recheck the measurement path |
| Accepted value = 0 | Undefined | Zero-point checks, offsets, blank samples | Absolute error and tolerance instead | Do not divide by zero |
⚖Error Type Reference Table
| Error Type | Formula | Direction Kept? | When It Helps | Common Mistake |
|---|---|---|---|---|
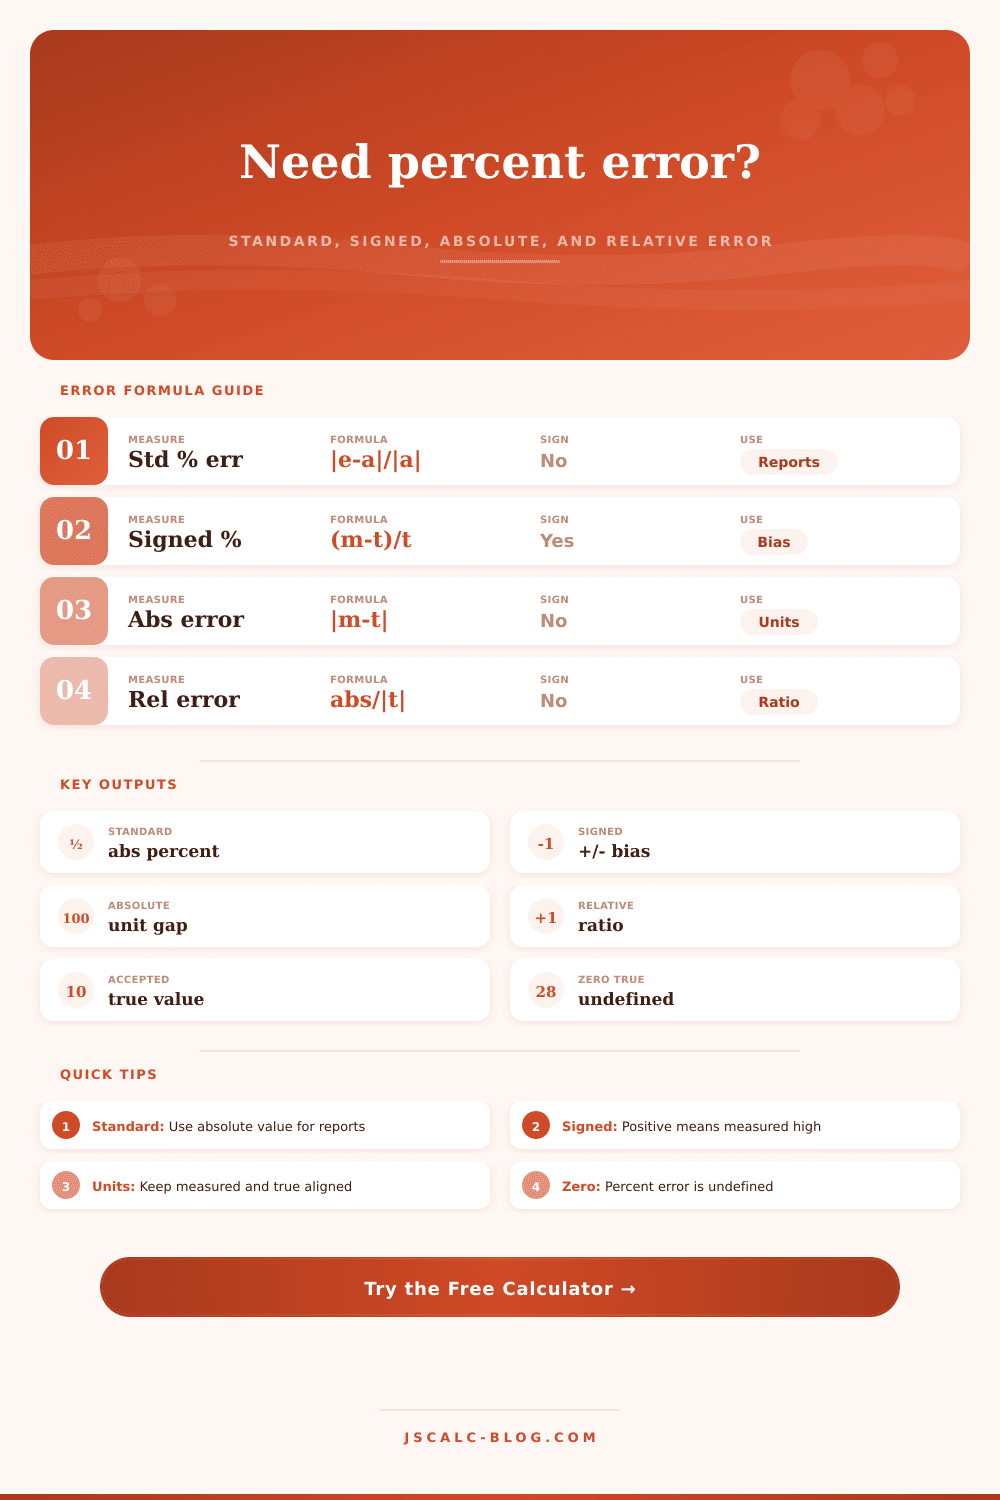
| Standard percent error | |experimental - accepted| / |accepted| x 100 | No | Unsigned lab reports and comparisons | Forgetting absolute values |
| Signed percent error | (measured - true) / true x 100 | Yes | Bias direction and calibration drift | Mixing sign conventions |
| Absolute error | |measured - true| | No | Tolerance checks in original units | Dropping the unit label |
| Relative error | absolute error / |true| | No | Scale-free comparison before percent | Calling it a percent before x 100 |
| Signed absolute difference | measured - true | Yes | High or low diagnosis in unit scale | Reporting only magnitude |
| Uncertainty ratio | uncertainty / absolute error | No | Checking whether the gap is explainable | Using unlike units |
💡Percent Error Tips
Educational calculation only. For regulated calibration, quality release, clinical validation, or legal reporting, follow the applicable measurement standard and documented uncertainty method.
Imagine you’re standing in a high school chemistry lab and looking down at a beaker full of some kind of copper solution. According to the textbook, density ought to be 8.96 grams per cubic centimeter, yet when you place the beaker on the scale it say 8.78. Did you mess up? Is there something wrong with the measuring tool? The difference between the two measurements… That’s what we call the uncertainty of an experiment; is at the very center of all of experimental science.
It’s not just a number, but rather a gauge of our confidence. And once you enters your values into the calculator above, it does the rest of the work for you, saving you the mental effort of trying to juggle denominators and absolute values. Then you can focus on what really matters: the result itself.
Understanding Percent Error
So here’s the catch: What exactly are we measuring? Most folks assume that there is only one kind of percent error, and they’d be right…if they were using standard percent error. In fact, percent error are two different things: standard percent error is a measure of magnitude (how wrong am I?) with no information about direction (overshoot or undershoot?), whereas signed percent error provide that direction. Teachers expects the former in your lab reports. This is because if you are comparing a large difference in mass to a small difference in voltage, you will need a way to scale this error relative to the true value. On the other hand, the latter will tell you something else entirely; it lets you identify a systematic bias in one of your sensor so that you can try to correct it.
Two percent doesn’t mean anything until it’s put into context. Two percent is what separates a C from an A in a university physics lab. Two percent is great when you’re taking measurements in the field with a handheld probe for soil moisture. This is neatly expressed in reference table on the page that lists error bands from very large to very tight. It wouldn’t make sense to judge an error without knowing where it was measured.
If I’m taking diameter of a machined pin, even tenths of a percent error would be alarming. If I’m estimating the volume of rain in the field, there’s enough chaos built-in that the same percentage is insignificant. Match the tolerance to the task.
The accepted value is one of the more popular traps. Percent error is defined as follows. You cannot divide by zero. Therefore, if your accepted value is zero, the math doesn’t work. It is a common problem when measuring temperatures in an ice bath or when checking the zero point on instruments like electronics. Then, you just throw out the percentage and go to looking at absolute error. It is a plain old gap between units, and you know whether the instrument has drifted beyond its usable range. The tool flags it for you. However, knowing why the denominator figure into the equation helps you avoid trying to force a percentage where there isn’t one. It saves you from making up precision that simply isn’t supported by the physics of what you are doing.
The silent killer of accuracy is unit consistency. Comparing a pin that’s measured in millimeters to a standard that’s measured in centimeters will result in a huge percent error. It won’t appear as a mathematical error. It’ll appear as total failure, it could of been avoided. Before putting anything into the calculator, make sure your units line up. This one appears obvious, yet it’s the first thing folks forget when they’re trying to rush their calculations. Remember: Your calculator doesn’t magically fix poor inputs. Do what you can to make sure the measured value and the accepted value match based off the data.
So, ultimately, there’s no such thing as failure when you make a mistake; there’s only information. If you made a tiny mistake you’re nearly home free; if you made a big one you have more work to do on the methodology itself. And that’s true whether you’re a student filing a paper or an engineer calibrating a sensor. The point is to understand precisely what confidence you should place in that number staring back at you. The distance between the real world and your measurement: that’s where the real work starts.