Accuracy and Precision Calculator
Enter true positives, true negatives, false positives, and false negatives to calculate accuracy, precision, recall, specificity, balanced accuracy, error rates, and class balance checks.
🎯Scenario Presets
📝Confusion Matrix Inputs
Name the class, disease, defect, alert, or event treated as positive.
Predicted positive and actually positive.
Predicted negative and actually negative.
Predicted positive but actually negative.
Predicted negative but actually positive.
🧮Metric Grid
📊Current 2x2 Matrix
📐Metric Formula Table
⚖Accuracy vs Precision Reading Table
| Pattern | Typical Signal | Best Metric To Check | What It Usually Means | Reporting Caution |
|---|---|---|---|---|
| High accuracy, low precision | Many true negatives | Precision and FP rate | Positive predictions include many false alarms | Accuracy may look good because negatives dominate |
| High precision, low recall | Few false positives | Recall and FN rate | Positive predictions are reliable but many positives are missed | Useful only if misses are acceptable |
| High recall, low precision | Few false negatives | Precision and review load | Broad capture with many positive follow-ups | May burden reviewers or confirmatory testing |
| Balanced accuracy above accuracy | Minority class performs well | Class prevalence | Raw accuracy was pulled down by harder majority cases | Inspect both class denominators |
| Accuracy above balanced accuracy | Class imbalance | Specificity and recall | One class may be carrying the headline score | Use the balanced value in summaries |
| Similar precision and recall | Stable positive class | F1 score | False positives and false negatives are similarly controlled | F1 ignores true negatives |
🗂Preset Reference Table
| Preset | TP | TN | FP | FN | Main Read |
|---|---|---|---|---|---|
| Rare disease screen | 92 | 855 | 45 | 8 | High accuracy with precision limited by low prevalence |
| Fraud review queue | 410 | 9850 | 310 | 90 | Accuracy is excellent, precision shows review efficiency |
| Spam filter batch | 840 | 1280 | 70 | 110 | Strong precision and recall for a common positive class |
| Defect vision station | 66 | 1840 | 80 | 14 | Raw accuracy looks high while precision needs attention |
| Triage risk model | 146 | 690 | 160 | 4 | Recall is prioritized and false-positive load is visible |
| Confirmatory lab test | 188 | 776 | 24 | 12 | High precision and specificity support rule-in use |
| Moderation classifier | 620 | 2140 | 260 | 180 | Balanced accuracy shows both sides more fairly than accuracy |
| Search relevance audit | 330 | 520 | 95 | 55 | Precision is strong for top-result quality checks |
| Plant disease detector | 118 | 642 | 58 | 32 | Recall and specificity are both important for field action |
| Small pilot validation | 18 | 62 | 13 | 7 | Small denominators need interval context |
⚙Full Formula Breakdown
💡Reporting Tips
Educational calculation only. For clinical, regulatory, security, or production model decisions, validate the reference labels, sampling plan, and operating threshold.
It’s amazing first time you run a model that gets 98 percent correct. It feels magical. But then you look at confusion matrix and notice that positive cases is rare and so the model just guesses everything as negative every single time. That’s the classic trap of binary classification.
When your data are unbalanced, accuracy lies. We has precision, recall, and specificity to tell us how wrong our system is and specifically which types of mistake it makes.
Why Accuracy Is Not Enough
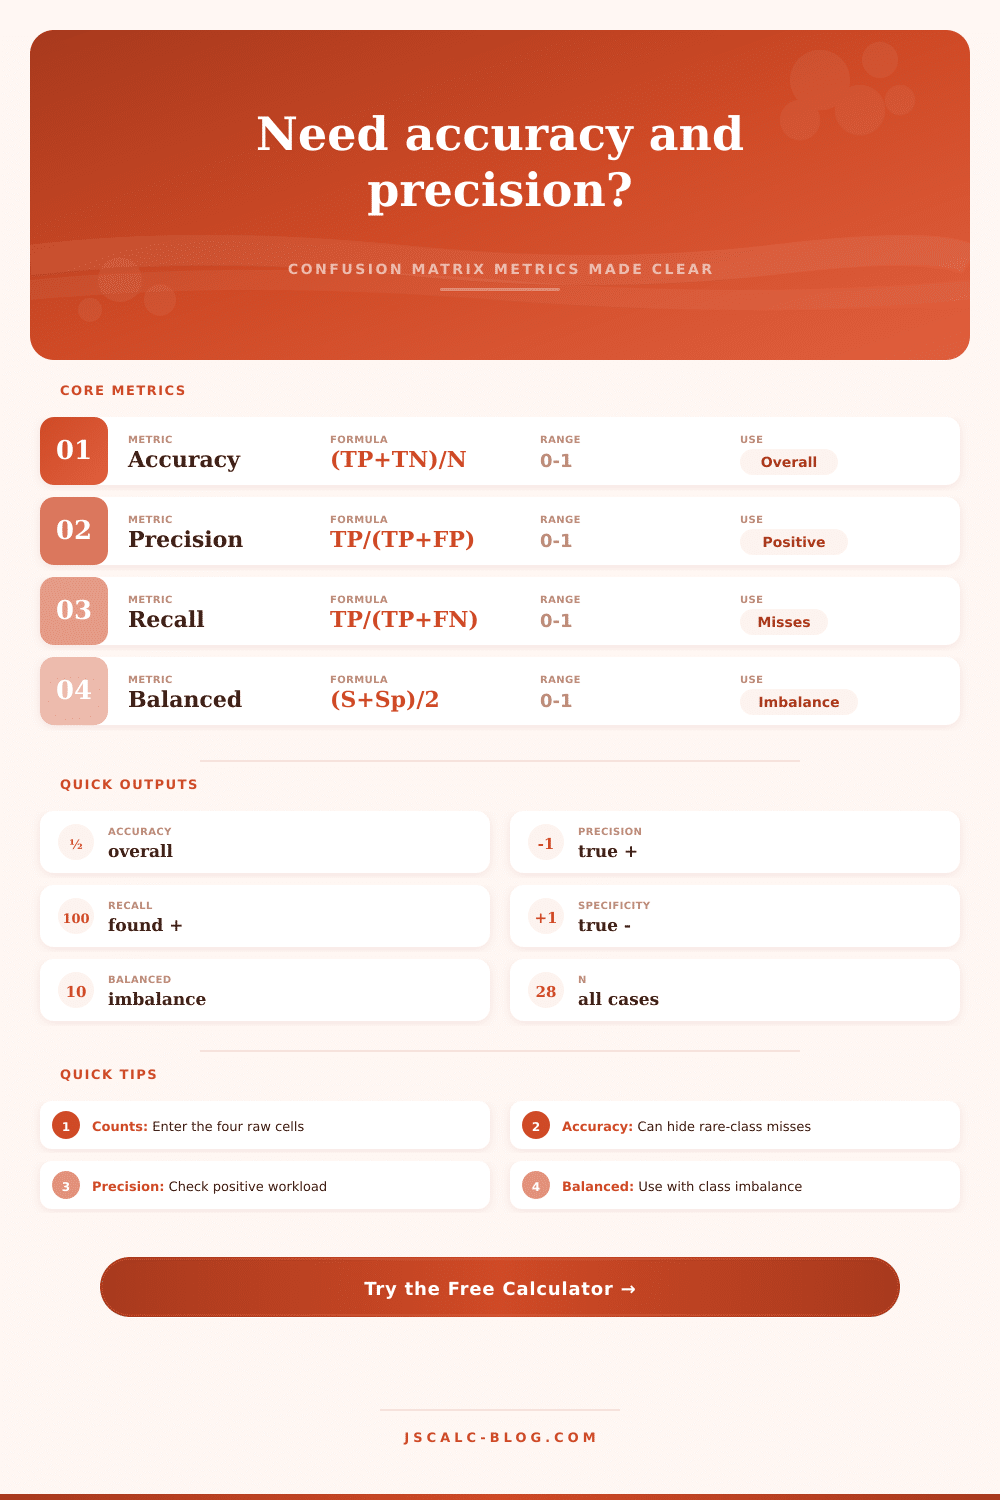
Begin with those four raw cells that make up a performance: The hits you want (true positives). The correct rejections (true negatives). The alarms that proved nothing (false positives). The misses that slid through the cracks (false negatives). The arithmetical combinations of these can get complex; but you don’t need to worry about them, since calculator above will do the math for you. Instead, you can concentrate on the tradeoff itself.
What’s important is not what the numbers say, it’s how well you grasp the cost of being wrong in each direction. That’s why input is more significant then the output. False positives are annoying in a security context; they waste your time and frustrate users by blocking them unnecessarilly. False negatives is potentially fatal in a medical context; if you tighten the criteria to reduce false alarms, you’ll inevitably miss more real threat. If you loosen the criteria so you catch everything, you’ll drown in noise. This is the essence of machine learning evaluation: how do you solve this tension?
Recall answers the coverage part of the question: how many actual events do you miss? Do you think there may be something wrong with half the things you’re flagging? Then your team won’t trust the flags anymore. Precision answers the confidence part of the question: How many of the things you say are positives really is? If it’s low, you’ll think a lot of what you’re looking at is harmless. To put this another way, spam filters typically wants high precision so they don’t miss real emails. In fraud detection, however, they may sacrifice precision for higher recall to make sure they don’t miss anything.
When classes are skewed, use balanced accuracy (computed by this page’s tool). The majority class dominate standard accuracy; e.g., if 99% of your data is negative, a dumb classifier which always returns “negative” will be 99% accurate. Balanced accuracy treats both class equally, averaging sensitivity and specificity. When the baseline is lopsided, it is a fairer, though harsher!, judge., judge.
Also consider false negative rate and the false positive rate, which are just one minus recall and one minus specificity respectively. They place error into context. An error rate of five percent sounds terrible, but does that apply to the majority or just the rare positive class? You can see how those rates change for various scenarios in the reference table on the page.
For instance, a spam filter is very different than a rare disease screen. You need high recall to not miss any cases. The other wants high precision so it doesn’t clutter things up. Depending on your context, you’ll argue for one or the other. For example, in search, you want to optimize for precision, since people evaluate the top result. In triage, you want to optimize for recall: You can’t afford to miss a high-risk patient.
The calculator shows an F1 score, which represents the harmonic mean between precision and recall. While convenient for comparison shopping, it hides details of error distribution. Examine the underlying components.
But with small data sets, you get big confidence intervals. Your precision is easily thrown way off by just a handful more true positives. The tool shows Wald intervals to illustrate this range of uncertantey. Maybe you see an apparent point estimate of 0.95 but really it’s anywhere from 0.85 to 1.0 given your tiny sample size. That’s honest reporting. It doesn’t let you be overconfident when seeing initial results.
So bottom line: it’s a proxy, not an end in itself. You’re not optimizing for a score. You’re optimizing for some kind of business outcome. And understanding that tradeoff is more valuable then learning to plug in formulas. It’s easy math. Deciding is where things get difficult. When you understand the cost of each error type, then the metrics isn’t abstract numbers any longer, they’re tools that you can use to manage your risk. That’s why peeking under the hood matters.