Negative Predictive Value Calculator
Calculate NPV from a 2 x 2 diagnostic table or from sensitivity, specificity, and prevalence using Bayes theorem.
Calculation breakdown
| Test result | Condition present | Condition absent | Total | Value used |
|---|---|---|---|---|
| Run the calculator to fill the matrix. | ||||
| Metric | Formula | Numerator | Denominator | Result |
|---|---|---|---|---|
| Run the calculator to compare predictive values. | ||||
| Prevalence | NPV | FOR | PPV | Expected FN per 10,000 |
|---|---|---|---|---|
| Run the calculator to compare prevalence scenarios. | ||||
| Quantity | Formula | Plain meaning | Use |
|---|---|---|---|
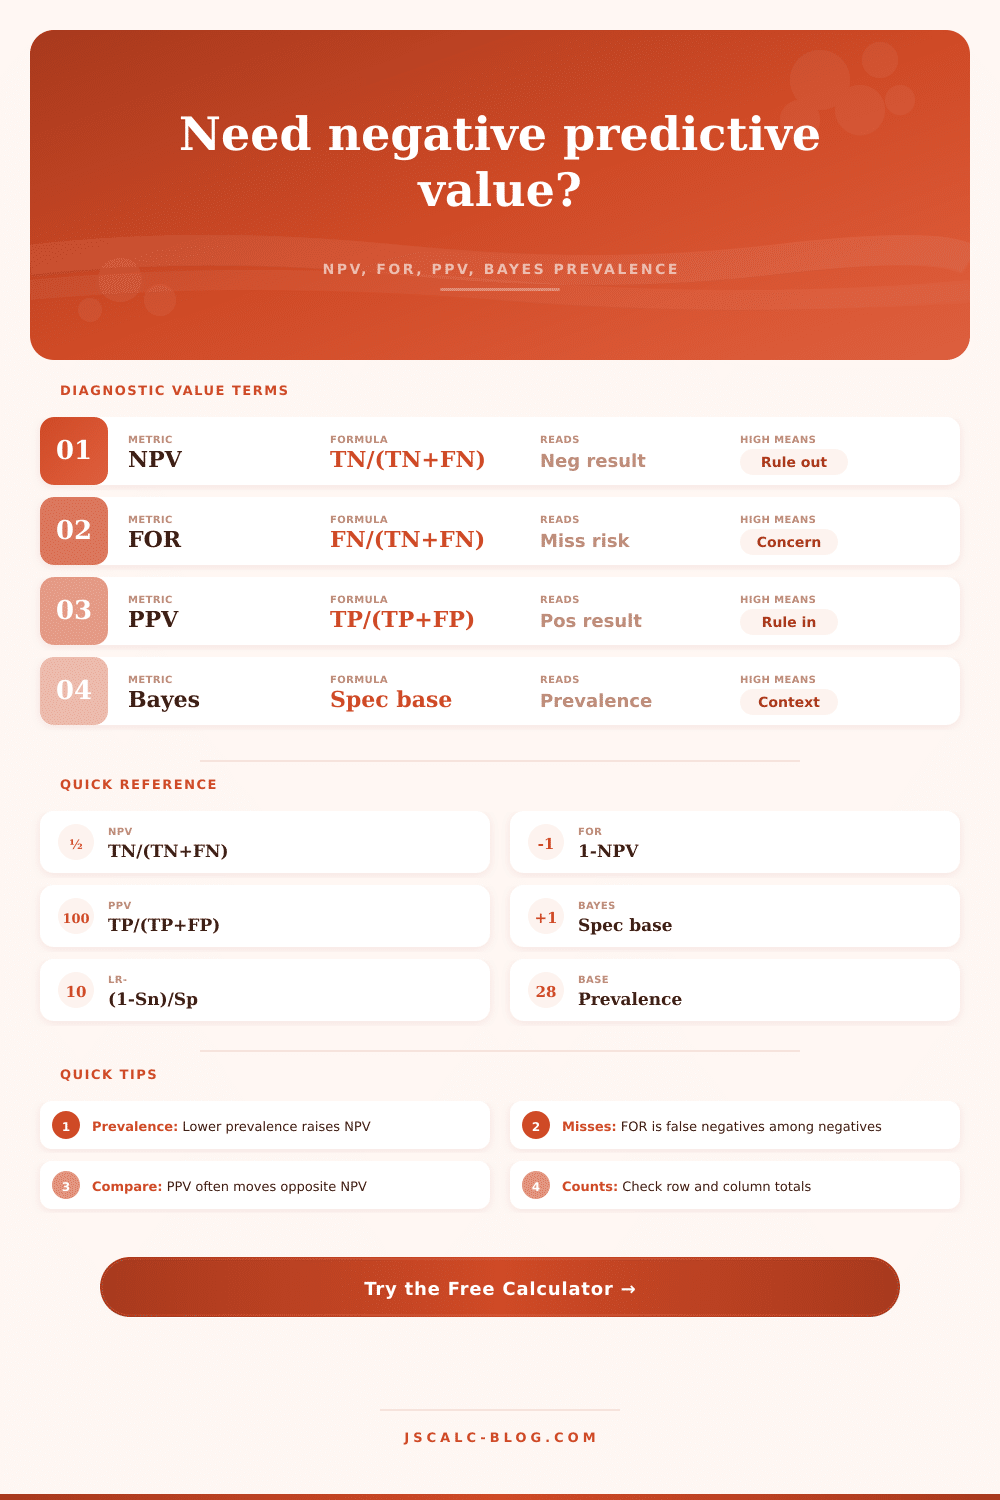
| NPV | TN / (TN + FN) | Share of negative tests that are truly negative | Rule-out confidence after a negative result |
| Bayes NPV | spec x (1 - prev) / ((1 - sens) x prev + spec x (1 - prev)) | Same NPV from test traits and prior probability | Estimate NPV before local counts exist |
| FOR | FN / (TN + FN) | False negatives among all negative results | Miss risk after a negative result |
| PPV | TP / (TP + FP) | Share of positive tests that are true positives | Rule-in confidence after a positive result |
| LR- | (1 - sensitivity) / specificity | How much a negative result lowers odds | Bayesian post-test odds checks |
| Accuracy | (TP + TN) / total | Correct calls among all tested cases | Broad performance, not a predictive value |
Okay, you got the bad news: negative. Clear, said the screen and cleared you as healthy, said the doctor. But unless you know what a negative truly signifies in real world, that feeling of relief may be empty. A negative isn’t a promise of good health and it’s more than a mere chance statistic that currently favors you. That’s why we’re talking about negative predictive value. It’s not just another metric to memorize for a board exam; it’s also the unique answer to the question: “Am I safe to assume I’m ok based off my test result?
Once you input your variables into the calculator above, it do the math for you. No need to wonder whether or not your number is good enough to influence your decisions. Why should this matter? The answer lie beyond the test itself. It lives in interaction with the population you are testing. Intuition often breaks down at this point.
What Negative Predictive Value Means for You
We tend to view sensitivity and specificity as inherent characteristics of the tool. They aren’t. They are rates. These rates only becomes predictive values when mixed with another factor called prevalence.
What is prevalence? It’s the background rate of the condition in the group you are testing. If you test for something rare in the general population, a negative result is almost always correct. The negative predictive value will be very high and you can be confident ruling out the disease.
Now flip that equation around and suddenly the math look very different. When you’re screening a high risk population and everybody is symptomatic, a negative is much less trustworthy. A test that was ninety-nine percent certain of the answer in one situation could plummet to eighty percent in another. And that’s what most folks is missing. They think that a test is simply either working or not. It isn’t. It’s conditional.
The tool on this page allows you to see that conditionality at work because it will let you plug in new prevalence values. You’ll see the negative predictive value shift with increasing commonness in your hypothetical population.
The other figure to keep in mind is the false omission rate. That’s just the inverse of the negative predictive value. This shows your risk when you choose to accept a negative result. The lower the false omission rate, the higher the negative predictive value.
Doctors often use tests with an extremely high sensitivity in urgent care situations. They want to be able to rule something out fast. Because the test is sensitive, that means it catch nearly all people with the disease. So if the test comes back negative, there is a very high likelihood it’s because the disease is not present.
You can also use the calculator to see how sensitivity affects the resulting predictive values. The engine under the hood is Bayes theorem. It lets you calculate those numbers without running the tests on a patient sample, just given an estimated prevalence of the condition and characteristics of the test itself.
This means it’s useful when planning. When you’re doing a quality screen on a manufacturing line, you have to know how many false negatives you can afford. The tool expresses that as misses per thousand tests. That makes it feel more real than theoretical. Maybe 40 misses per thousand is tolerable for a cosmetic flaw. That would of been catastrophic for a safety component.
The bottom line is that a negative test result is a probability, not an absolute truth and its reliability depends on the prevalence of the condition. Look at the big picture. Don’t just focus on the sensitivity. Focus on the false omission rate (look for prevalence). If you’re working with positive results, compare that to the positive predictive value. On the page, they have a reference table that puts it all out there.
These metrics go in opposite directions, as prevalence increases the PPV also increases but the NPV decreases. Certainty is a zero sum game. That’s why understanding this dynamic prevents you from drawing conclusions from half the data.
It reminds you that a negative test isn’t certain. It’s a probability update. You had a prior belief, formed by how common it is. Then you ran a test, which updated your belief. When the negative predictive value is high, you now believe you’re healthy. When the negative predictive value is low, you might want a more specific second test to confirm it.
That’s where those equations realy come into play. They teach you how to know when you’re finished testing and when you aren’t. Only when the math is on your side should you believe the negative. And that math depends entirely upon the context within which you took the test.
Knowing when to stop worrying is just as important than knowing when to start looking.