Number Needed to Treat Calculator
Convert control event risk and experimental event risk into absolute risk reduction, number needed to treat, number needed to harm, confidence interval bounds, and expected cohort impact using the standard risk-difference formulas.
🏥Clinical and Public-Health Presets
📝Trial or Program Inputs
Choose the use case so the result wording fits the decision.
Enter CER and EER as event risks for the same outcome and time window.
Risk in the comparison, placebo, usual-care, or unexposed group.
Risk in the treated, vaccinated, screened, or exposed group.
Use the study's lower bound for RD = CER - EER.
Use the study's upper bound for RD = CER - EER.
Used to estimate events prevented or extra harmful events in a cohort.
NNT and NNH are tied to this time horizon and should not be compared across unlike durations.
🔢Core Formula Snapshot
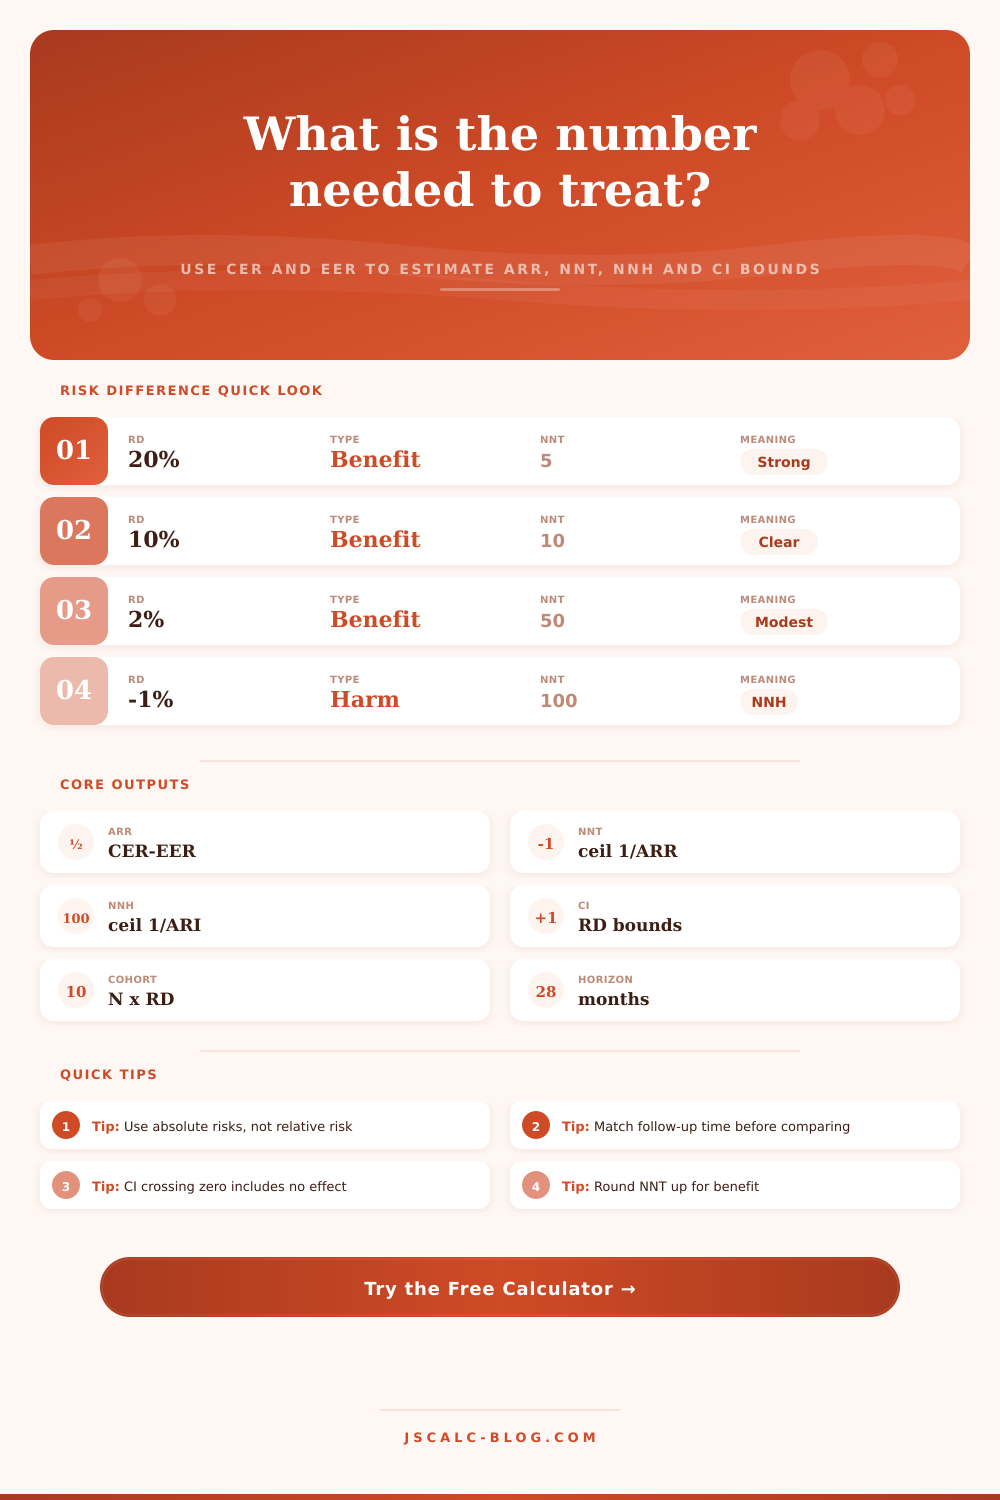
📊Risk Difference to NNT Quick Lookup
| Risk Difference | Decimal | NNT or NNH | Clinical Scale |
|---|---|---|---|
| 25 percentage points | 0.25 | 4 | Very large absolute effect |
| 20 percentage points | 0.20 | 5 | Large effect for common outcomes |
| 10 percentage points | 0.10 | 10 | Clear effect in many decisions |
| 5 percentage points | 0.05 | 20 | Moderate absolute effect |
| 2 percentage points | 0.02 | 50 | Modest effect, still important at scale |
| 1 percentage point | 0.01 | 100 | Small individual effect, large population effect |
| 0.2 percentage points | 0.002 | 500 | Typical of rare outcomes |
| 0 percentage points | 0 | Not defined | No absolute risk difference |
🧪Clinical Example Comparison Grid
| Scenario | Follow-up | CER | EER | RD | NNT or NNH | Main Caution |
|---|---|---|---|---|---|---|
| Statin primary prevention CV events | 10 years | 7.5% | 6.0% | +1.5 pp | NNT 67 | Baseline risk drives value |
| Influenza vaccine symptomatic flu | 1 season | 6.0% | 2.5% | +3.5 pp | NNT 29 | Season severity changes CER |
| Insecticide bed nets malaria cases | 12 months | 20.0% | 12.0% | +8.0 pp | NNT 13 | Local transmission matters |
| Falls injury prevention program | 12 months | 18.0% | 12.0% | +6.0 pp | NNT 17 | Risk mix affects uptake |
| Relapse prevention therapy | 12 months | 45.0% | 28.0% | +17.0 pp | NNT 6 | Outcome definition must match |
| Screening mortality endpoint | 10 years | 0.30% | 0.20% | +0.10 pp | NNT 1000 | Rare outcomes give high NNT |
| Hospital infection bundle | 6 months | 9.0% | 5.5% | +3.5 pp | NNT 29 | Before-after bias can inflate effect |
| Anticoagulant major bleeding | 12 months | 1.8% | 3.0% | -1.2 pp | NNH 84 | Balance against prevented stroke |
📈Confidence Interval Interpretation
| RD CI Pattern | Effect Side | NNT CI Method | Plain Language | Report Example |
|---|---|---|---|---|
| Both bounds above 0 | Benefit | Invert upper then lower RD | All plausible effects prevent events | NNT 20, CI 13 to 50 |
| Both bounds below 0 | Harm | Invert larger absolute harm then smaller | All plausible effects cause events | NNH 84, CI 50 to 250 |
| Lower below 0, upper above 0 | Mixed | CI crosses infinity | Benefit, no effect, and harm are plausible | NNTB 25 to infinity to NNTH 100 |
| One bound equals 0 | Touches none | One side is infinity | The confidence interval includes no effect | NNT 25 to infinity |
| Point RD equals 0 | No point effect | NNT not defined | No absolute difference at the point estimate | No NNT point estimate |
| Bounds reversed | Data entry issue | Sort before inversion | The calculator reorders bounds for display | Lower and upper swapped |
📋Input Quality Checklist
| Check | Why It Matters | Good Input | Weak Input |
|---|---|---|---|
| Same follow-up | NNT is time dependent | Both risks at 12 months | CER at 1 year, EER at 5 years |
| Same outcome | ARR requires matched endpoints | Hospitalization in both groups | Hospitalization vs any visit |
| Absolute risks | Relative risk cannot be inverted directly | CER 12%, EER 8% | Risk ratio 0.67 only |
| Direction named | Positive RD means benefit only for bad events | Unwanted event prevented | Good outcome without conversion |
| CI sign convention | Bounds must match RD = CER - EER | Lower 1 pp, upper 5 pp | Bounds from EER - CER |
| Clinical context | Same NNT can mean different value | Severe endpoint and low burden | Minor endpoint and high burden |
⚙Formula Breakdown
💡NNT Interpretation Tips
On paper, these relative risk reductions look pretty good. You see a 30% reduction in heart attacks, and it seems like an advance; it’s something that should influences your judgment. But relative risk completely disregards how frequently that event happen as a baseline. In other words, if the baseline risk is low, then even a big improvement in relative risk doesn’t do much for individual patient.
The absolute numbers are far more important than the percentages doctors mention in press release, those are the real chances of something happening.
Why Real Numbers Are More Important Than Percentages
Number Needed to Treat Number Needed to Treat fills this void, bringing abstract numbers down to earth in human units. How many people need to undergo this intervention for exactly one person to be helped over the alternative? You can’t escape the treatment’s cost and side effects when you’re told that you’ll have to treat fifty people to save a single life. When it come to people instead of populations, the math is more difficult to sweep under rug.
The correct way to use it is with both the Experimental Event Rate and the Control Event Rate (the probabilities of the outcome occurring in the treated group versus the untreated group). The untreated). This is what the calculator subtracts/inverts for you; however, if your risk figures don’t match (i.e., same definition and time-frame), then you’ll end up with gibberish. For instance: You can’t compare a one year infection rate to a ten year mortality rate. That’s why the resulting NNT is meaningless.
The time frame anchors the number, an NNT of twenty over six months is not the same as an NNT of twenty over a decade. You might be tempted to interpret this as meaning there’s no change: if the range of plausible risk differences crosses zero, it could mean anything from a benefit to harm. But you need to check the confidence interval to see what it say. In this case, the believable range of risk differences includes both negative and positive values, which means that technicaly, the NNT extends from harm to benefit with infinity in between. That’s a statistical red flag. Either the study was small (so less precise) or the effect was modest, neither of which support a confident recommendation at this point.
As the table further up on the page illustrates, even slight changes in the risk difference move the NNT around. It illustrates importance of having good precision in your input estimates.
They’re used by public health planners as a way to best distribute resources. For a single patient, a high NNT (and therefore a small absolute risk reduction) appears inefficiently. But for a big population, those tiny fractions sum up to thousands of avoided events. That’s the paradox of preventive medicine: We accept high NNTs for important outcomes to spare everyone from the misery of widespread illness. Population benefit vs. Individual efficiency, that’s the tension in today’s preventive care.
Additionally, don’t mix up the “number needed to harm” with the “number needed to treat”. For instance, a medication that prevents a heart attack in every 50 people it’s administered to may lead to substantial bleeding in one out of every hundred. Those are different numbers… Pay attention to both. Ultimately, you’re trying to balance those different values: how bad would it be to prevent this versus how bad would it be to have this side effect? If the first is catastrophic and the second is mild, a high NNT is fine.
The ultimate decision relies on context. For one set of people, a statin may offer the same NNT as a different drug. But that doesn’t mean it offers the same value. Some patients will be more concerned about side effects from medication than others; some are worried about their family history, while others want to do everything they can to lower their genetic risk. Raw numbers comes from the calculator; meaning comes from the discussion with the patient.
When it comes to medicine, going from relative risk to an absolute measure clarifies medical marketing. The result is that you get rid of the hype and are left with the plain facts: what exactly will this intervention do for me? When you move away from percentage points and toward actual people, numbers becomes wise decisions. You should of looked at the absolute numbers first.