Sample Size for a Proportion Calculator
Estimate the completed responses needed to measure one population proportion with a chosen confidence level and margin of error. Add finite population correction, design effect, and response rate to turn the statistical n into a fieldwork plan.
📌Survey and Research Presets
🧮Proportion Sample Size Inputs
Higher confidence uses a larger z critical value and raises n.
Use 50% when no prior estimate is available; it gives the largest n.
This is the half-width around the estimated proportion.
Enter 0 or leave small effect ignored when the population is effectively unlimited.
Used to estimate invitations or contacts needed to obtain completed responses.
Use 1.00 for simple random samples; cluster or weighted surveys often use more.
Protocols usually round completed sample size upward.
🔢Current Planning Snapshot
📐Formula Breakdown
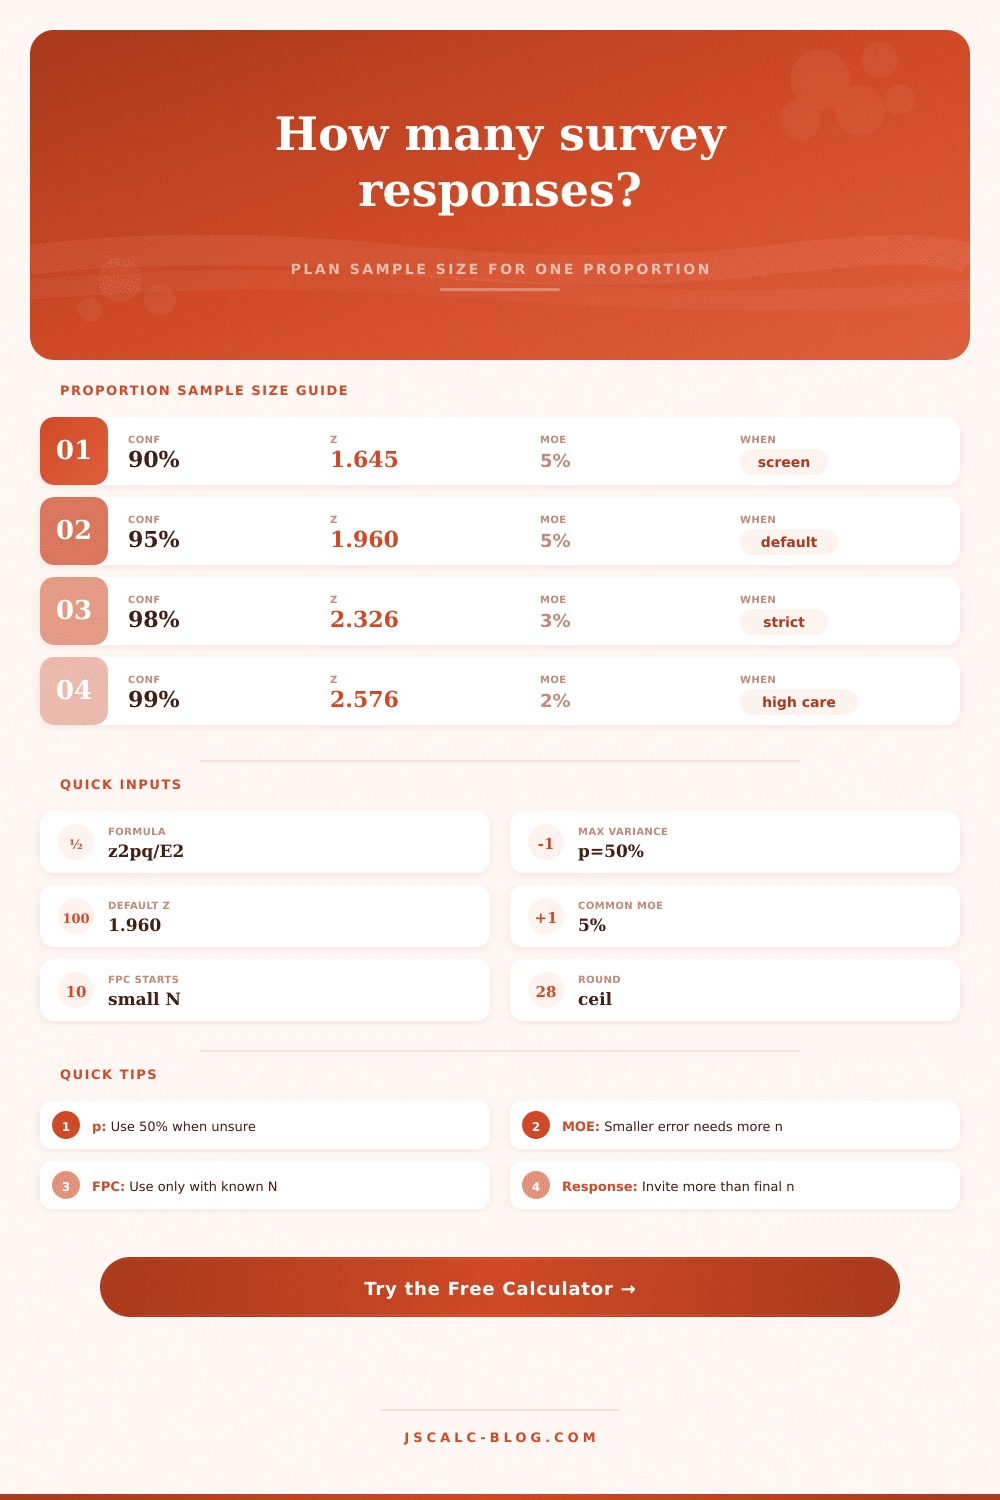
📊Confidence Level Z Reference
| Confidence | Two-Sided z | Alpha | At p = 50%, E = 5% | Typical Use |
|---|---|---|---|---|
| 80% | 1.282 | 0.20 | 165 | Fast internal read |
| 85% | 1.440 | 0.15 | 208 | Screening survey |
| 90% | 1.645 | 0.10 | 271 | Exploratory research |
| 95% | 1.960 | 0.05 | 385 | Common reporting |
| 98% | 2.326 | 0.02 | 542 | Stricter publication |
| 99% | 2.576 | 0.01 | 664 | High confidence claim |
🔍Expected Proportion Planning Table
| Expected p | p x (1 - p) | 95% n at 5% | 95% n at 3% | Planning Meaning |
|---|---|---|---|---|
| 5% or 95% | 0.0475 | 73 | 203 | Rare or very common outcome |
| 10% or 90% | 0.0900 | 139 | 385 | Low prevalence estimate |
| 20% or 80% | 0.1600 | 246 | 683 | Skewed but not rare |
| 30% or 70% | 0.2100 | 323 | 897 | Moderate split |
| 40% or 60% | 0.2400 | 369 | 1025 | Near maximum variance |
| 50% | 0.2500 | 385 | 1068 | Safest unknown-p default |
🧪Survey Preset Reference
| Preset | Confidence | Expected p | MOE | Population | Response | Design Effect |
|---|---|---|---|---|---|---|
| National opinion poll | 95% | 50% | 3% | Unlimited | 20% | 1.20 |
| Customer satisfaction | 95% | 72% | 4% | 50,000 | 25% | 1.00 |
| Employee engagement | 95% | 60% | 5% | 1,200 | 70% | 1.10 |
| Market screening | 90% | 35% | 6% | Unlimited | 35% | 1.00 |
| Clinical prevalence | 99% | 12% | 2.5% | 200,000 | 55% | 1.15 |
| Classroom survey | 95% | 50% | 8% | 180 | 90% | 1.00 |
| Member vote estimate | 95% | 48% | 4% | 8,500 | 45% | 1.00 |
| Quality audit pass rate | 90% | 95% | 2% | 12,000 | 100% | 1.00 |
| Rare event prevalence | 95% | 3% | 1% | 500,000 | 60% | 1.25 |
⚖Comparison Grid for Common Designs
| Design | Confidence | p | MOE | Population N | Base n | FPC n | Final n | Invite at Rate |
|---|---|---|---|---|---|---|---|---|
| Opinion poll | 95% | 50% | 3% | Unlimited | 1068 | 1068 | 1281 | 6405 at 20% |
| Customer score | 95% | 72% | 4% | 50,000 | 485 | 480 | 480 | 1920 at 25% |
| Employee pulse | 95% | 60% | 5% | 1,200 | 369 | 283 | 311 | 445 at 70% |
| Market screen | 90% | 35% | 6% | Unlimited | 171 | 171 | 171 | 489 at 35% |
| Prevalence study | 99% | 12% | 2.5% | 200,000 | 1122 | 1115 | 1283 | 2333 at 55% |
| Class project | 95% | 50% | 8% | 180 | 151 | 83 | 83 | 93 at 90% |
| Member vote | 95% | 48% | 4% | 8,500 | 600 | 560 | 560 | 1245 at 45% |
| Audit pass rate | 90% | 95% | 2% | 12,000 | 322 | 313 | 313 | 313 at 100% |
| Rare event | 95% | 3% | 1% | 500,000 | 1118 | 1116 | 1395 | 2325 at 60% |
💡Practical Sample Size Tips
Your hypothesis begins as a guess. Perhaps you believe your customers is less happy. Maybe you think a new product feature are more popular then the old one. It’s not that the guess is the issue. It’s proving it (while avoiding spending money on either an absurdly large survey you can’t afford or a tiny survey that won’t be useful). That’s where sample size calculation comes into play as a tool in your decision-making kit. Plug in your desired margin of error and confidence level; the calculator does the rest. No need for you to guess at conversions and coefficients.
First, let’s look at the expected proportion. The conventional wisdom here is to take half if you have absolutely no idea what result should be. Why? This is because a result of half allow for the largest range of possible outcomes. Dividing things halfway creates the least certainty. So the less certain you are about something, the more people you should of ask until they nail it down. But if you know your pass rate, say, is going to be ninety percent, then you can afford to ask fewer person because the variation has decreased. Yes, I know it’s tiny. It affects your wallet, though. And the reference table explain it all. As the proportion approaches zero and one, you’ll see that sample requirement decreases.
How to Choose the Right Sample Size
What’s your margin of error? How much wiggle-room are you comfortabley with? Suppose you think that 30% of users like a given feature. A five percent margin implies the truth lies between 25-35%. That gives you plenty of wiggle-room for in-house planning. Perhaps it’s still too wide for public press-release. A two percent margin sounds good. Shrinking that error to two percent sounds better, but it drastically increase the number of people you need to contact. Accuracy comes at a price. Are you prepared to spend an additional thousand surveys just to get within one-point of truth?
You can easily forget about population correction until you survey your own company. Surveying 500 employees does not require same sized sample that surveying 5 million does. The math corrects for it. Sampling a large portion of a smaller pool means you’re getting more info from each individual sampled. The calculator takes into account the correction and applies it automaticly based on population size you input. This often shaves off a significant number of respondents needed.
The design effect is the variable that makes all the difference. The textbook ideal is simple random sampling. Real life are messy. Clustering your sampling by region? Your effective sample size shrinks. Weighting the results to match demographic characteristics? Your effective sample size shrinks. To get same amount of statistical power, you need more raw data. Don’t account for this and you’re going to be overconfident. Publish results that seem precise when in fact they’re shaky because you didn’t accounted for underlying data structure.
And last but not least: don’t mix up invites and completed surveys. The tool calculates how many completed survey are required. And if your survey’s expected response rate is 30%, then you should invite around three times that many. This is where studies fail in the planning stage. Planners assume they’ll get ideal number of people who complete the survey. They overlook the fact that most won’t even click their link. That’s what the tool bridges. Based off the response rate you estimate, it estimates the number of invites you’ll need.
It’s a balance between rigor and reality: How big should the sample size be? You’d like it large enough to have confidence in the result. It should be small enough that you’re not drowning in the noise. It isn’t an exercise in statistical perfection. It’s an exercise in practical use. Begin with your hunch. Then set the bounds. And let the numbers inform your fieldwork.