Average Duration Calculator
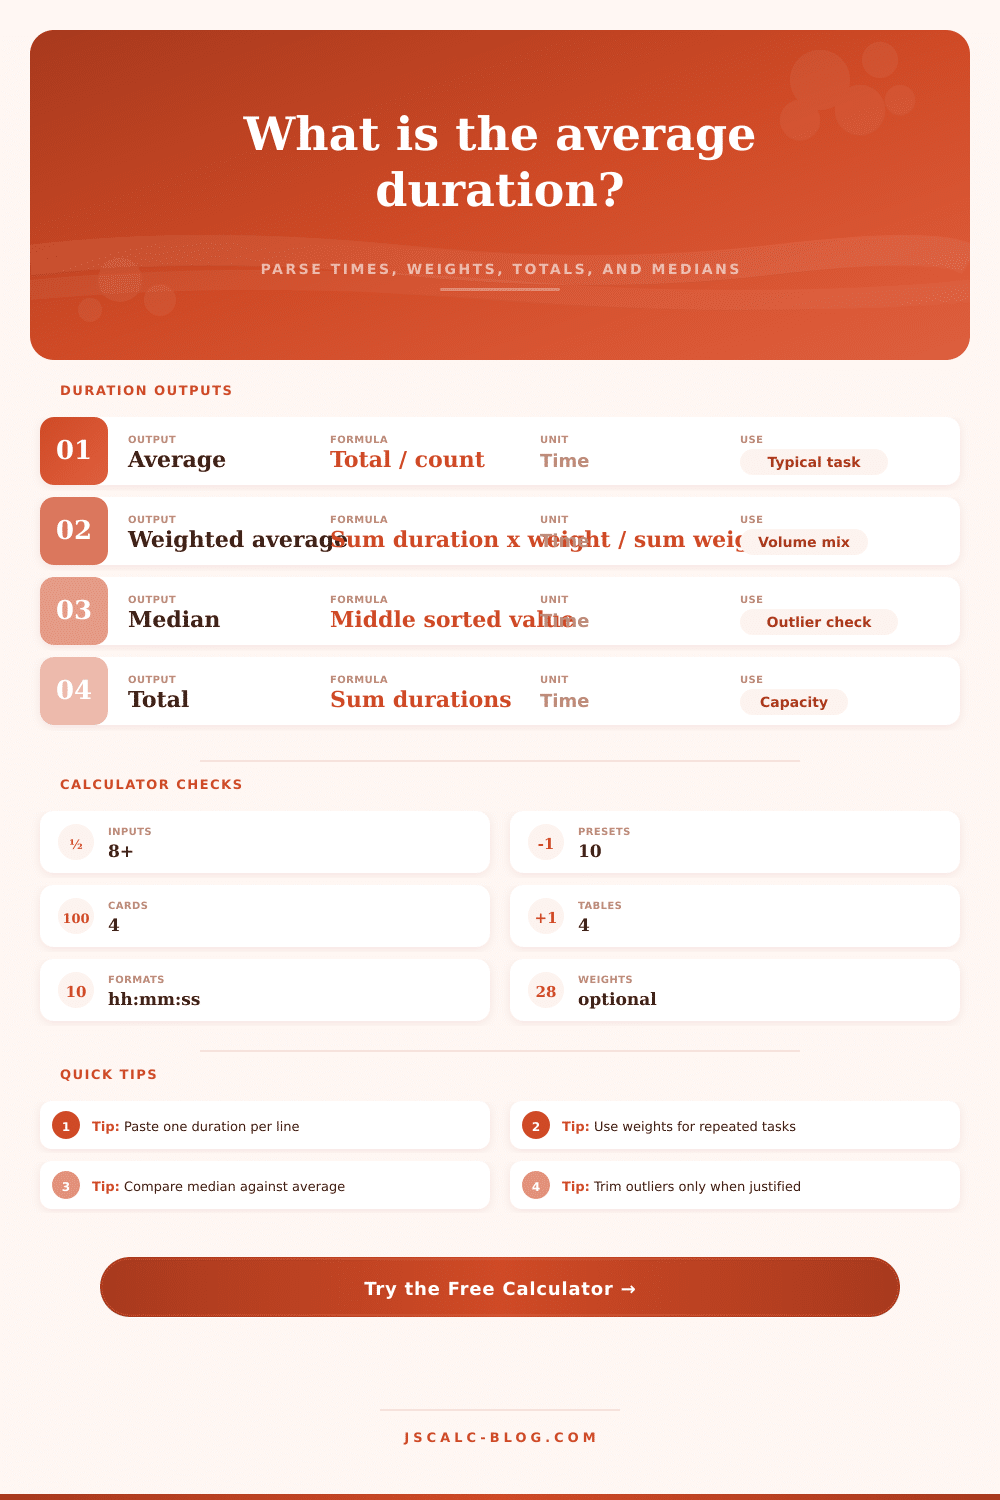
Paste durations as hh:mm:ss, mm:ss, h:mm, minutes, or decimal hours. The calculator converts everything to seconds, then reports average duration = total duration / count plus weighted average, median, min, max, and total time.
📌Duration presets
⚙Calculator inputs
Accepted examples: 01:25:30, 25:30, 1h 12m 5s, 0.75h, 45m, 2700s, or decimal hours when selected below.
One weight per duration. Leave blank to treat every duration equally; use this for repeated jobs, volume mix, or sample counts.
Optional. If greater than valid entries, total duration stays the same but average uses this count.
📊Duration results
🔍Quick stats
🧮Formula breakdown
📋Parsed entry table
| # | Entry | Parsed duration | Weight | Target status |
|---|
📈Scenario comparison table
| Scenario | Count basis | Average | Weighted average | Total for projection |
|---|
⏲Duration format reference
| Entry style | Example | How the calculator reads it | Best use |
|---|---|---|---|
| hh:mm:ss | 01:12:30 | 1 hour, 12 minutes, 30 seconds | Videos, shifts, events |
| mm:ss | 18:45 | 18 minutes, 45 seconds unless the first number is large enough to imply hours | Calls, support, workouts |
| Unit text | 1h 20m 15s | Reads each unit and sums seconds | Copied notes or logs |
| Decimal hours | 1.5h or 1.5 with hour mode | 1 hour, 30 minutes | Timesheets and capacity plans |
| Decimal minutes | 45m or 45 with minute mode | 45 minutes | Short operations |
🗂Comparison grid
Every parsed entry counts once.
Optional weights reflect volume.
Average multiplied by tasks per batch.
Average compared with target duration.
💡Average duration tips
Your brain can’t do the math when you see a list of video timestamps or calls logs. Some are all over the place; others seem rushed. Hours gets mixed with minutes. If you try to calculate average by hand, you’ll mess up. With this calculator, it converts the units and does the division for you.
It takes that jumbled column of time strings and makes it clear: how much time did you typically spend on each thing? It is not simply a calculation of numbers. It gives you a sense of what an average event cost you in time.
Why This Tool Helps You Manage Your Time
This is about knowing what’s being measured. An average time to solve is a good stat, but it’s meaningless unless you look beyond it. Averages can be misleading. What if I recieve nine easy requests that are solved within two minutes and then one complicated problem requiring one hour? The average will be between those two extremes. In practice this doesn’t mean much. For every quick win, there’s another piece of the long tail.
And so this tool also displays the median. The median represents “middle” value of your list of durations (assuming everything was sorted). This is how your typical task would feel. It is nothing too extreme and is not skewed by any particularly difficult jobs. It is a small distinction, but it is important for planning your workday.
Use weights to make the data more honest. Consider a content calendar or a manufacturing line. Some things occur ten times a day. Others happen only once a month. When you enter both into the same list and treat them equally, you’ll skew the average. You’re averaging volume, but not frequency.
Enter a weight for each entry’s duration. That tells system how often that exact time block occurs in practice. A high-weighted short task will drag the average down. A low-weighted rare long task won’t dominate it either. Here’s where the weighted average helps. It reflect your actual operation, not just the diversity of the tasks involved.
And then there’s outliers. We’ve all got them in our datasets. A speaker ran long. A server went down. If you leave each second intact, you’re inflating your planning numbers. Trim ’em with the calculator. You can eliminate the longest and shortest times to see how core of your performance fares. Or you can flag any entry that falls outside the normal. Either way, you’ll know whether the outlier represents a real problem or just noise.
Once you trim, does the average dip dramaticly? Then you’ve got a variability issue on your hands. Stay steady? Consistent process. Know the difference, that’s half the battle.
Another reason folks get stuck is because of formats. We have data from various sources. Some systems gives us minutes and hours. Other systems give us decimal hours. Yet others only give us seconds. It’s tedious to try to standardize this data before analysis.
The tool automaticly parses all of it. You simply paste in the list, and the tool will convert everything into a common unit behind-the-scenes. That means no more manual conversion errors creeping in because you’re tired. And, you can now compare between different units without any math worries. Simply switch the output to whichever format makes sense for your team (e.g., clock time or decimal hours for payroll).
Finally, consider capacity. What’s an average? It is a snapshot. What’s a projection? A plan. Multiply your firm average by your projected task volume. You get a total time needed. How many hours will you need to service a hundred incoming tasks? The calculator does that for you.
It turns statistics into real numbers for your resources, and lets you determine whether existing equipment and/or staff will be enough. That’s essential for operations, shifting you from talking about “how long did we take?” to “can we handle what is coming?
The bottom line: Time is merely one more resource to manage and measure. You don’t need to be a math geek to manage it. Managing it means knowing what an average realy shows about how your time is spent. Is it the weighted average (volume impact), the median (typical case) or some other? Doesn’t matter. You want to know where your time is going. And those tools let you see it for real.
That visibility is why you can plan better, because you’re seeing reality, not just theory from your spreadsheet. So start with what you’ve got. Tidy it up. Let the numbers talk. Make a decision based off what happens in your day, not the theory in your spreadsheet.