Absolute Risk Reduction Calculator
Enter treatment and control event counts to calculate CER, EER, ARR = CER - EER, number needed to treat, risk difference confidence interval, relative risk reduction, and events avoided per 1000.
🎯Absolute Risk Reduction Presets
🧮Risk Reduction Inputs
Profile changes the interpretation wording, not the ARR formula.
CI uses the Wald standard error for the risk difference.
Events in the control or comparison group.
Total participants, units, or observations in control.
Events in the treatment, intervention, or new-process group.
Total participants, units, or observations in treatment.
For beneficial events, a negative ARR may mean the intervention increased good outcomes.
NNT uses the unrounded ARR and is rounded up when ARR is positive.
🔢Current Study Snapshot
📐Formula Breakdown
📋Preset Comparison Grid
| Scenario | Control Events | Control N | Treatment Events | Treatment N | ARR | NNT / NNH | Typical Reading |
|---|---|---|---|---|---|---|---|
| Cardiac event trial | 120 | 1000 | 80 | 1000 | 4.00 pp | NNT 25 | Clear absolute reduction |
| Vaccine disease endpoint | 180 | 2000 | 45 | 2000 | 6.75 pp | NNT 15 | Large prevention effect |
| Readmission reduction | 96 | 600 | 72 | 620 | 4.39 pp | NNT 23 | Useful service impact |
| Surgical infection | 38 | 800 | 20 | 820 | 2.31 pp | NNT 44 | Moderate hospital endpoint |
| Adverse event prevention | 34 | 500 | 22 | 500 | 2.40 pp | NNT 42 | Fewer unwanted events |
| Relapse prevention | 70 | 300 | 46 | 310 | 8.49 pp | NNT 12 | Large absolute benefit |
| Rare screening endpoint | 52 | 10000 | 45 | 10000 | 0.07 pp | NNT 1429 | Small individual effect |
| Quality defect pilot | 64 | 1200 | 38 | 1180 | 2.11 pp | NNT 48 | Process improvement signal |
| Treatment harm signal | 25 | 700 | 41 | 690 | -2.37 pp | NNH 43 | Treatment event rate is higher |
🧭ARR Interpretation Bands
| ARR Range | Events Per 1000 | NNT Approx | Practical Scale | CI Check | Plain Reading |
|---|---|---|---|---|---|
| Below 0 pp | Negative | NNH | Possible harm | Check if CI excludes 0 | Treatment has more events than control |
| 0.00 to 0.49 pp | 0 to 4.9 | 200+ | Very small | Often needs large n | Absolute effect is hard to see individually |
| 0.50 to 1.99 pp | 5 to 19.9 | 51 to 200 | Small | Width matters | Important for common or serious endpoints |
| 2.00 to 4.99 pp | 20 to 49.9 | 21 to 50 | Moderate | Report exact CI | Usually meaningful in trials and programs |
| 5.00 to 9.99 pp | 50 to 99.9 | 11 to 20 | Large | Check endpoint coding | Strong absolute reduction |
| 10.00 pp or more | 100+ | 10 or less | Very large | Check baseline risk | High-impact intervention when valid |
🔍Confidence Interval Method Table
| Choice | z Critical | Interval Width | Use When | Reminder |
|---|---|---|---|---|
| 90% CI | 1.645 | Narrowest | Exploratory summaries | Less conservative than 95% |
| 95% CI | 1.960 | Standard | Most trial reports | Use with ARR and NNT together |
| 98% CI | 2.326 | Wider | Stricter internal review | Needs adequate event counts |
| 99% CI | 2.576 | Widest | High-confidence screen | Rare events can become very wide |
| Wald RD CI | Selected z | Symmetric | Fast transparent checks | Can be rough near 0% or 100% |
| Newcombe or exact | Varies | Often better | Formal sparse-data reports | Use statistical software for final inference |
🧪ARR vs Related Measures
| Measure | Formula Core | Null | What It Shows | Best Use | Main Caution |
|---|---|---|---|---|---|
| Absolute risk reduction | CER - EER | 0 | Absolute event-rate drop | Patient and program impact | Depends on baseline risk |
| Risk difference | EER - CER | 0 | Signed treatment-control gap | Regression and trial tables | Opposite sign of ARR |
| Number needed to treat | 1 / ARR | n/a | People treated per event avoided | Clinical communication | Only defined as NNT when ARR > 0 |
| Risk ratio | EER / CER | 1 | Relative remaining risk | Comparing proportional change | Can hide small absolute effects |
| Relative risk reduction | (CER - EER) / CER | 0 | Percent reduction vs baseline | Headline effect size | Inflates rare-event impressions |
| Odds ratio | odds_t / odds_c | 1 | Odds scale association | Case-control or logistic models | Not the same as ARR |
💡Practical ARR Tips
A headline saying a new drug halves heart attack risk sounds like a breakthrough. We feels excited. But what if the risk was two in a thousand and now it’s only one in a thousand? For example, a headline claiming a new drug cuts heart attack risk by half sounds impressive, but absolute effect might be tiny. Most of the confusion about clinical trials lives here: it’s the space between relative and absolute numbers. Small effects is made to sound dramatic on a relative scale (good if you want to sell something, not so good if you’re trying to decide whether to pop a pill with side-effects).
The absolute risk reduction takes away the scaling and shows you how many fewer events there was per thousand when you move from standard care to the new treatment. How many fewer bad things happened.
Why Absolute Risk Matters More Than Percentages
Once you know how many people there were in each group (your sample size) and how many event occurred during the study (how many times people got sick or whatever), you can plunk them into this handy-dandy little calculator up top and let it do all the math for you. It saves you from wrestling with standard errors and confidence intervals by hand.
First, you type in total number of people who received treatment. This is your sample size. Then, you enter the number of events (the amount of sickness or whatever) that happened in those people. That yields your experimental event rate, also known as baseline risk or control event rate. Next, you do the same for the treatment group. That yields the experimental event rate. Subtract the two numbers and you have your absolute risk reduction.
A positive number indicate the treatment helped. A negative number indicates the treatment hurt. This matters, because a negative absolute risk reduction shows the number needed to harm. It is not a number needed to treat.
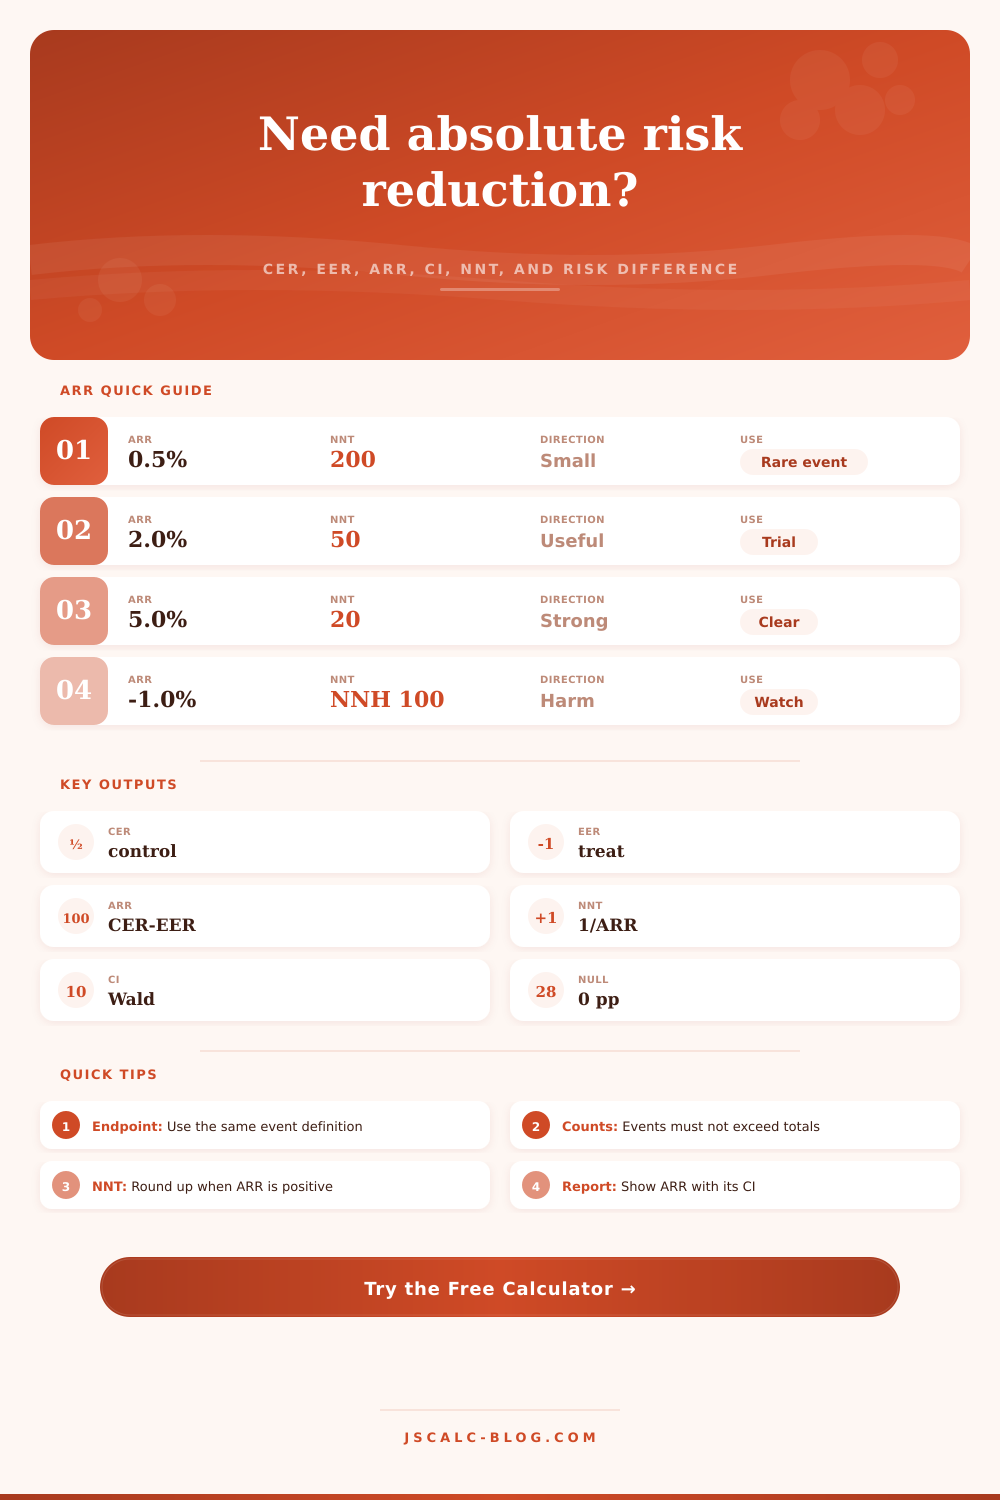
Perhaps the most human-readable result of all is the number needed to treat. This tells you how many patient you have to treat to avoid one more bad outcome. In our example, if the absolute risk reduction is two percent, then that’s fifty people you’ve got to treat to save one person. But what if the reduction was only half a percent? Then you’ve got to treat two hundred people to save one. Although the relative risk reduction may appear to be the same in each case (and it could well be), the difference between fifty and two hundred is huge when it comes to patient burden and hospital resources. That’s why the reference table on the page shows how different absolute reductions translate to a practical level of impact, from very small through to very large.
Beyond the point estimate, the confidence intervals are important. You may see a four percent decrease and a confidence interval of minus one to nine percent (ninety-five percent confidence). That’s not statistically significant because it include zero. The apparent benefit could just be random noise.
In general, the tool relies off the Wald method for calculating the confidence interval, which for large sample sizes is standard but at the edges can be rough. If your event rates are very low or very high, the confidence interval will likely be narrower than appropriate, so take care interpreting such results. A five percent absolute risk reduction is strong if it’s for a rare side effect, and weak if it’s for a life-threatening condition. To understand the benefit of an intervention, you must also understand its baseline risk. Even a large relative risk reduction won’t translate to much of an absolute benefit if the initial risk was already low. Because of this, the calculator lets you switch between preset scenarios, like a surgery infection rate or how well a vaccine works. This allows you to run same math across various medical situations and adjust your expectations to match before diving into your own data.
And then there’s reporting. Always report the absolute risk reduction accompanied by both the number needed to treat AND its confidence interval. These three together paint an accurate picture of how effective something is, and how precisely we know that effect size. The danger of just reporting relative percentages (the percent reduction) is that it make things seem better than they really are. So whenever you read a study result: Find the absolute numbers first. They may not be as flashy, but they’re a whole lot more truthful to what the intervention actualy does in the real world.
Absolute risk reduction helps you read medical articles differently. It takes you away from exciting percentages and puts your feet on solid ground. Instead of wondering how much better, it makes you wonder by how many people they was helped. That is an important distinction, even if it sounds small. It allows statistical abstractions to become concrete choices regarding our health and our resources. It’s simple arithmetic. But interpreting that arithmetic could of require a firm grasp and a sharp eye for what those numbers mean.