Relative Risk Reduction Calculator
Enter treatment and control event counts to calculate CER, EER, relative risk, relative risk reduction, absolute risk reduction, NNT or NNH, and approximate confidence intervals.
🎯Named Risk Reduction Presets
🧮Risk Reduction Inputs
Event count in the intervention, treatment, exposed, or new-process group.
Total participants, patients, visits, users, or units in the treatment group.
Event count in the control, placebo, comparison, unexposed, or old-process group.
Total observations in the control or baseline group.
RR CI uses the standard log risk ratio approximation.
RRR is most natural when the event is a bad outcome being reduced.
A continuity correction keeps RR and log CI finite for zero-event arms.
Internal calculations keep full precision; this only changes the display.
🔢Current Risk Snapshot
📐Formula Breakdown
📋Preset Comparison Grid
| Scenario | Treatment Events | Treatment Total | Control Events | Control Total | Approx RR | Approx RRR | Typical Reading |
|---|---|---|---|---|---|---|---|
| Vaccine trial | 18 | 1000 | 72 | 1000 | 0.25 | 75% | Large relative reduction, clear absolute context needed |
| Statin event prevention | 145 | 4200 | 196 | 4180 | 0.74 | 26% | Moderate relative reduction with low baseline risk |
| Hospital infection bundle | 26 | 2400 | 49 | 2350 | 0.52 | 48% | Meaningful prevention if definitions match |
| Safety device injuries | 9 | 850 | 21 | 820 | 0.41 | 59% | Wide CI likely because event counts are small |
| Education dropout program | 38 | 620 | 57 | 600 | 0.65 | 35% | RRR is helpful, ARR explains classroom impact |
| Adverse drug event | 64 | 1500 | 41 | 1480 | 1.54 | -54% | Negative RRR signals increased harmful risk |
| Screening recall rate | 112 | 3100 | 139 | 3050 | 0.79 | 21% | Process reduction; confirm outcome meaning |
| Website error reduction | 420 | 50000 | 690 | 50000 | 0.61 | 39% | Large sample creates precise CI |
| Rare event zero cell | 0 | 300 | 6 | 300 | 0.08* | 92%* | Correction-dependent teaching estimate |
🧭Risk Measure Reference Table
| Measure | Formula | Null Value | Scale | Best For | Main Caution |
|---|---|---|---|---|---|
| CER | control events / control total | Not fixed | 0 to 1 | Baseline risk | Changes across populations |
| EER | treatment events / treatment total | Not fixed | 0 to 1 | Intervention risk | Needs same event definition as CER |
| RR | EER / CER | 1 | Ratio | Relative comparison | Can hide small absolute effects |
| RRR | 1 - RR | 0 | Percent | Risk reduction headlines | Only intuitive for harmful events |
| ARR | CER - EER | 0 | Percentage points | Practical impact | Depends strongly on baseline risk |
| NNT | 1 / ARR | Infinite | People or units | Decision summaries | Only meaningful when ARR is positive |
🔍Confidence Interval Method Table
| Choice | z Critical | RR CI Method | RRR CI Conversion | Use When | Reminder |
|---|---|---|---|---|---|
| 90% CI | 1.645 | ln(RR) +/- zSE | 1 - upper RR to 1 - lower RR | Exploratory summaries | Narrower than 95% |
| 95% CI | 1.960 | ln(RR) +/- zSE | Invert the RR limits | Most reports | Approximate, not exact |
| 98% CI | 2.326 | ln(RR) +/- zSE | Same conversion | Stricter review | Needs enough events |
| 99% CI | 2.576 | ln(RR) +/- zSE | Same conversion | High-confidence claims | Can become very wide |
| Auto 0.5 | Selected z | Adds continuity correction | Finite RRR interval | Zero event arm | Sensitive with tiny samples |
| No correction | Selected z | Exact entered counts | Requires positive events | All event cells positive | Zero events break log RR |
⚖RRR Interpretation Bands
| RRR Value | Equivalent RR | Direction | Plain-Language Reading | Absolute-Risk Check |
|---|---|---|---|---|
| 75% or more | 0.25 or less | Large reduction | Treatment event risk is far lower than control | ARR may still be small if CER is rare |
| 50% to 74% | 0.26 to 0.50 | Strong reduction | Treatment roughly halves the event risk | Pair with NNT for decisions |
| 25% to 49% | 0.51 to 0.75 | Moderate reduction | Meaningful relative improvement | Baseline risk drives impact |
| 1% to 24% | 0.76 to 0.99 | Small reduction | Event risk is slightly lower in treatment | CI often determines credibility |
| 0% | 1.00 | No relative change | Treatment and control event rates match | ARR is also 0 percentage points |
| Negative RRR | Above 1.00 | Risk increase | Treatment event risk is higher than control | Report as relative risk increase or NNH |
💡Practical RRR Tips
“New drug reduces heart attack risk by 50%.” You stop scrolling because it’s a miracle. It is headline that sounds too good to be true. What you don’t realize, though, is that the number itself conceals an important story. This is the gap between absolute versus relative risk… A tiny difference magnified into giant headline.
Plug your numbers into the calculator above. It’ll do all the calculations for you (no need to convert things to percentages; no need to do coefficients).
Why Relative Risk Can Be Misleading
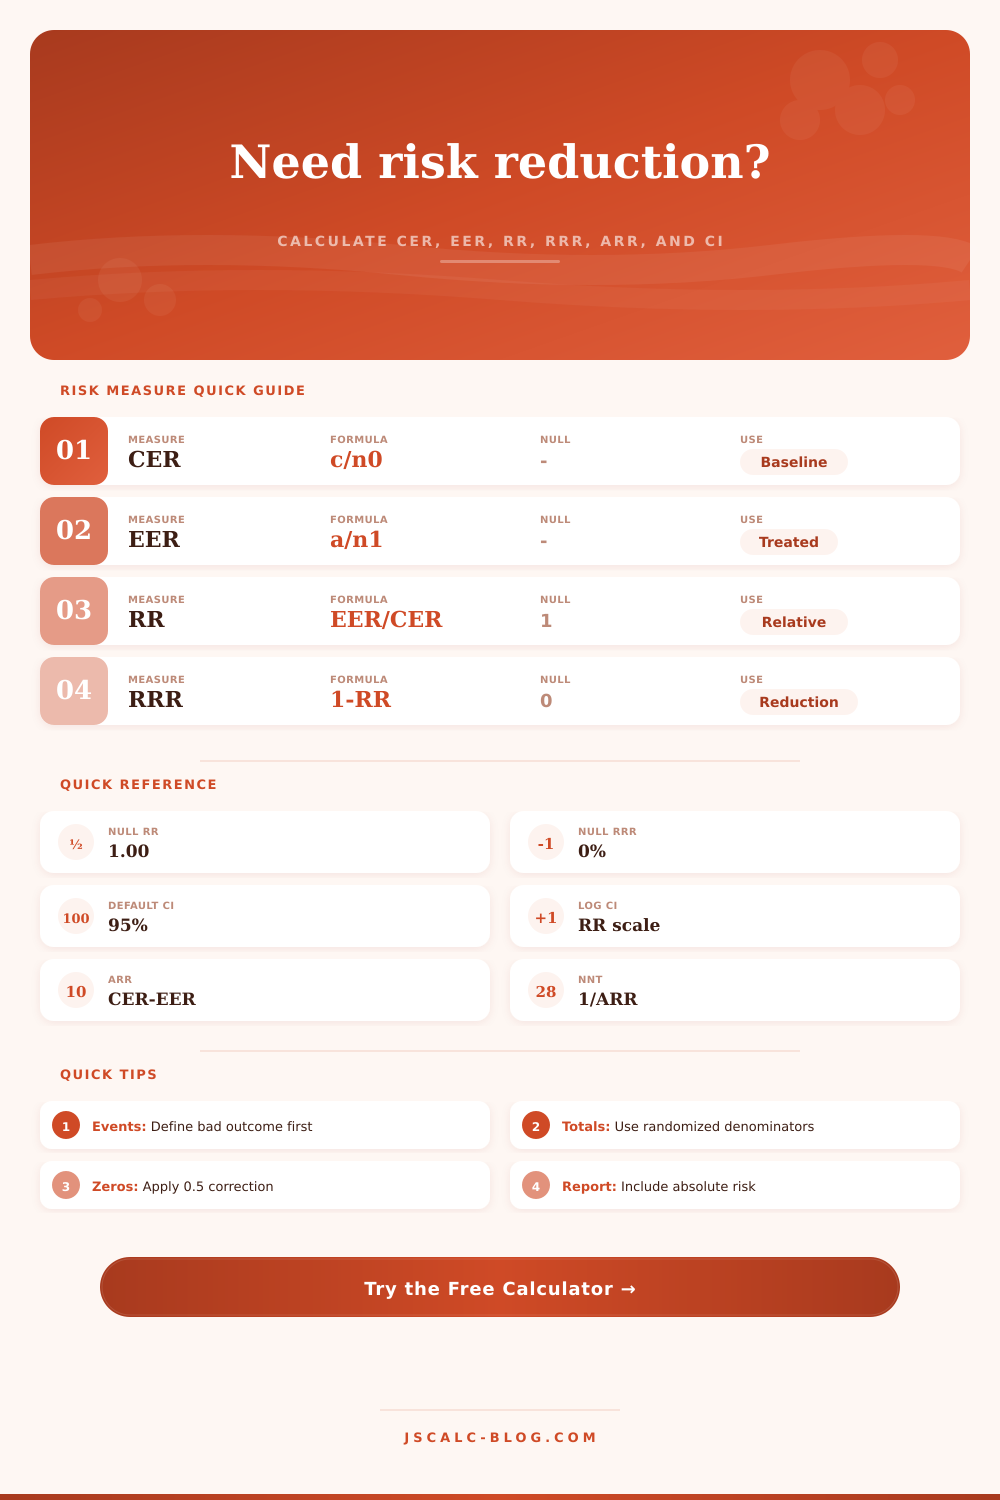
First, define the control event rate (CER). This is also known as your baseline risk. It ask how often this bad thing happens if nothing changes. Next, input the treatment event rate, or EER. If it’s less than the CER, then the intervention was effective. One minus the ratio of those two rates are called the relative risk reduction. It’s a tidy little fraction that isolates proportional drop.
Here’s where proportion gets us into trouble: it doesn’t account for scale. If your risk is one tenth of one percent to start with and then you reduce it by half, that still sounds like a lot. In reality, you’re changing things by practicaly nothing; you’ve only reduced something that wasn’t very likely to begin with.
It tell us the real, percentage-point difference between the control group and the treatment group. How do we get this? We subtract the two groups, control minus treatment. And although it looks smaller, it’s the truth.
The calculator will spit out an NNT (number needed to treat), which is inverse of the absolute risk reduction. For example, if the ARR is two percent, then you have to treat fifty people to prevent one event. That’s a concrete way to weigh cost against benefit. The lower the NNT, the more powerful and efficient the intervention; the higher the NNT, perhaps it’s too risky or expensive for everybodies. It’s a practical metric for decision makers who has to justify assigning resources.
You also need to be skeptical of confidence intervals. This are the range of plausible values around our best guess (the point estimate). If the bottom of that confidence interval touches zero, then maybe effect is nothing at all. When your event count is small, the confidence interval will remain accurate even as you go down to smaller numbers; this is because it apply a standard log transformation. You can adjust the confidence level if you want stricter certainty, though that usually widens the range.
The math for a division-by-zero is a headache. The formula for relative risk cannot divides by zero. The tool adds a tiny fraction to both counts and so provides a kind of continuity correction: the calculation continues and the result isn’t inflated so much. Flag this in your report; it indicates that either the real effect might have been unstable, or that it could even be larger.
Relative risk is beloved by humans. It can make something small look large. For individuals, it’s dangerous; for making treatment comparisons between groups of people, it’s handy. Combine it with absolute difference; and view the baseline risk. Even a massive relative drop in risk may result in a tiny absolute gain if your initial risk was low. Mathematically, there is no problem. Be careful with how you interpret it.
These measures arm you against hype. They turn marketing jargon into easy-to-understand figures. They makes you look past the percentage and ask what change really means. If you know what numbers to believe, then the numbers themselves won’t deceive you. But if not, they can mislead.
Pay attention to the number needed to treat and the absolute change. These are the metrics that would of stand up to inspection; they tell whether or not the intervention is worthwhile.
It’s little, I know. But it matters.