Risk Ratio Calculator
Compare event risk in exposed and unexposed groups using a 2×2 cohort table. Enter counts for a, b, c, and d to calculate risk ratio, risk difference, odds ratio, and a log-scale confidence interval.
🎯Study Scenario Presets
📝2×2 Table Inputs
Count of cases among exposed participants.
Count of non-cases among exposed participants.
Count of cases among unexposed participants.
Count of non-cases among unexposed participants.
Uses z in ln(RR) ± z × SE.
Correction prevents undefined RR or confidence intervals when a count is zero.
Only changes display labels; formulas use the same counts.
Used for interpretation wording, not formula changes.
🔢Current 2×2 Snapshot
📋Risk Ratio Interpretation Grid
| RR Range | Exposed Risk | Plain Meaning | Effect Direction | CI Check | Typical Wording |
|---|---|---|---|---|---|
| 0.20 to 0.49 | Much lower | Large protective association | Protective | Below 1 supports effect | Risk is greatly reduced |
| 0.50 to 0.79 | Lower | Moderate protective association | Protective | Below 1 supports effect | Risk is lower |
| 0.80 to 0.94 | Slightly lower | Small protective association | Protective | Watch precision | Risk may be lower |
| 0.95 to 1.05 | Similar | Near the null value | Little difference | Usually crosses 1 | Risks are similar |
| 1.06 to 1.24 | Slightly higher | Small risk elevation | Harmful | Watch precision | Risk may be higher |
| 1.25 to 1.99 | Higher | Moderate risk elevation | Harmful | Above 1 supports effect | Risk is higher |
| 2.00 to 3.99 | Much higher | Large risk elevation | Harmful | Above 1 supports effect | Risk is doubled or more |
| 4.00+ | Very high | Very large risk elevation | Harmful | Check bias and counts | Risk is sharply higher |
🧮Confidence Level Reference
| Confidence Level | z Value | Interval Width | Common Use | Formula Part |
|---|---|---|---|---|
| 90% | 1.644854 | Narrower | Exploratory analysis | ln(RR) ± 1.644854 × SE |
| 95% | 1.959964 | Standard | Most reports and papers | ln(RR) ± 1.959964 × SE |
| 99% | 2.575829 | Wider | Higher confidence summaries | ln(RR) ± 2.575829 × SE |
| Interpretation | Compare to 1 | Precision marker | All levels | If CI includes 1, RR is compatible with no risk-ratio difference |
| Scale | Log scale | Asymmetric after exponentiation | Risk ratios | Use exp(lower log) and exp(upper log) |
| Assumption | Large sample | Approximate | Cohort counts | Small counts may need exact or model-based methods |
⚖Zero-Cell Correction Choices
| Choice | When Applied | What Changes | Best For | Caution |
|---|---|---|---|---|
| Auto +0.5 | Only if any cell is zero | Adds 0.5 to all cells | General calculator use | Report corrected counts |
| No correction | Never | Uses raw counts | No zero cells | RR or SE can be undefined |
| Always +0.5 | Every calculation | Adds 0.5 to all cells | Conservative continuity approach | Can shift large clean tables slightly |
| Zero cells only | Only zero counts | Adds 0.5 to zero cells | Sensitivity checks | Changes margins unevenly |
| Exact methods | External analysis | Different model | Very sparse data | Not computed here |
| Model-based | Adjusted analysis | Regression estimate | Confounder control | Needs subject-matter model |
📐Common 2×2 Measures
| Measure | Formula | Uses | Null Value | Notes |
|---|---|---|---|---|
| Risk exposed | a / (a + b) | Event probability in exposed group | 0 | Shown as percent, per 1,000, or decimal |
| Risk unexposed | c / (c + d) | Baseline event probability | 0 | Denominator is all unexposed participants |
| Risk ratio | [a/(a+b)] / [c/(c+d)] | Relative risk comparison | 1 | Primary result in this calculator |
| Risk difference | Risk exposed - risk unexposed | Absolute excess or reduction | 0 | Useful for public-health impact |
| NNT or NNH | 1 / absolute risk difference | Number needed to treat or harm | None | Only meaningful when risk difference is not zero |
| Odds ratio | (a × d) / (b × c) | Odds comparison | 1 | Can diverge from RR when events are common |
⚙Formula Breakdown
💡Risk Ratio Tips
But what you’re seeing is a two by two table, and it looks uncomplicated. On one side are those who lived close to factory or took the medicine. On the other side are the controls.
And the issue isn’t simply whether they got sick. It’s also whether the ones exposed were far worse off then the others. This is where risk ratios live. They aren’t measuring absolute danger, but rather relative danger. Did being exposed change your fate? Or would of it have happened to you regardless?
Understanding What the Numbers Mean
Once you have all four cell counts entered into the calculator (the unexposed non-cases, the unexposed cases, the exposed non-cases, and the exposed cases), the tool calculates math for you (above). Most people will stop here. They plug in the numbers and they get their ratio. And then they say that this was better or worse than expected.
But a ratio is only as good as what you compare it to. A ratio of two at a base risk of twenty percent is very different from a ratio of two at a base risk of one-in-a-thousand. This tool shows you the absolute difference, or the actual change in probability, along with relative ratio, because the absolute difference drives decision about what should be done clinically and in public health.
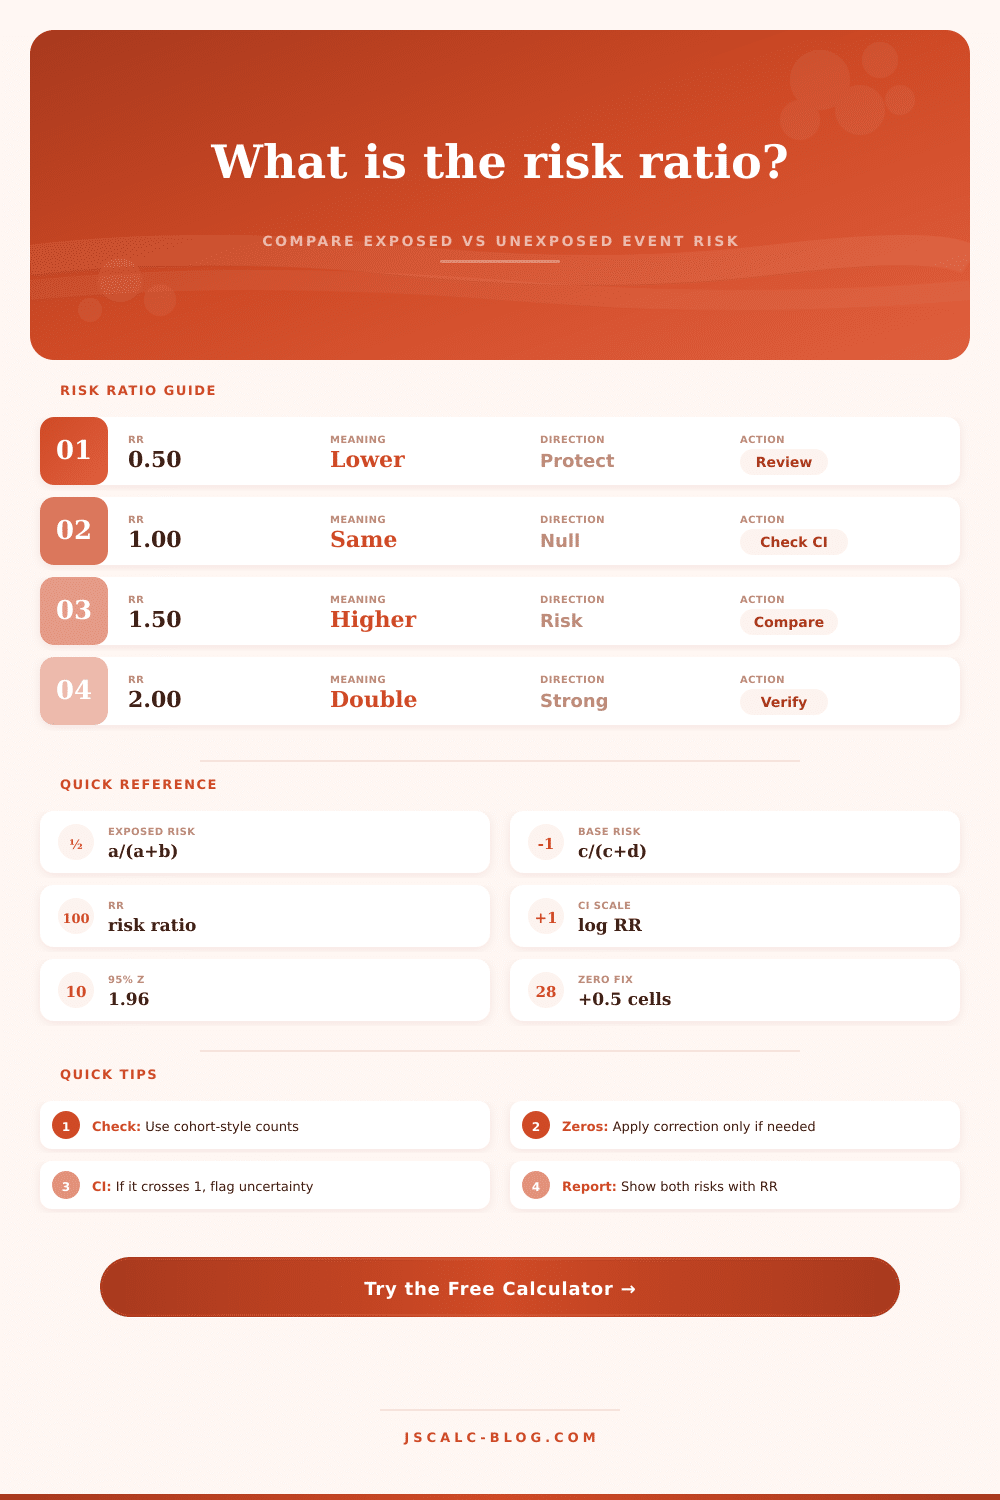
Then there’s the part that is most overlooked in results: the confidence interval. That’s built on the log scale, a typical statistical step designed to preserve symmetry within the interval prior to converting it back to the ratio scale. When it spans one, then the result has been deem statistically indistinguishable from zero. In other words, you can’t say there was an effect when the upper bound is adverse while the lower bound is protective. No go. Indeterminate. It says something about how unsure you should be, not what direction things are pointing. So that’s why reference table on the page spells it out for you explicitly. It makes you consider the precision of your estimate, not just its point value. And a big interval indicates that perhaps your event rate is too low or your sample size too small to make bold assertions.
The other problem is zero cells. Nobody in the exposed group become ill, so you have zero divided by something. This makes the entire equation fall apart. Therefore, you cannot compute log of zero. The solution is that calculators apply some sort of continuity correction, typically by adding a tiny amount (such as.5) to every cell to keep things numerically sane. This is a kind of statistical band-aid… You want to know it’s being applied because it will pull the ratio a little closer to 1, which means if you’re close to significance it could swing you from protection to no difference. This doesn’t matter much in big datasets where there are lots of numbers, but in little pilot studies it can alter the story from “protective” to “neutral.
That number alone doesn’t tell you how to interpret that. It’s necessary also to consider design of the study itself. The risk ratio is most naturaly used in randomized trials or cohort studies (where you follow a group of people forward over time). If the disease is not extremely rare, using the risk ratio biases your estimates if you instead begin with the outcome (case-control design) and look back. Then what is needed is the odds ratio. However, people often confuse this with the risk ratio. As a result, it frequently gets reported as a risk ratio when it actualy isn’t. When the outcome occurs commonly, the risk ratio is inflated so that effect sizes gets overestimated. If the event rate is high, the odds ratio will diverge greatly from the risk ratio which gives an illusion that the effect is larger than it truly is.
To make that point when reporting back on those results, present the raw risks too. Doubling the chance of a side effect will terrify people. A doubling of one-in-a-million odds to two-in-a-million sounds reassuring. The relative difference is big, but the absolute impact is not meaningful. Which scale did you mean? Your audience should be told. The calculator shows both; now let them select the right one for their needs. Only transparency can create trust in numbers.
But at its heart, the risk ratio is a link between numbers and people. It’s a way to translate count into something that can be compared. But it’s also a two-way bridge, a bridge you can cross from either side. If we see a protective ratio under one, does this reflect the effectiveness of a vaccine or bias in the study? If we observe a harmful ratio over one, does this imply the toxin is unsafe or that the control group had unusually good health?
The number by itself isn’t enough; it’s only the beginning of the story. Look at the interval. Examine the baseline. Determine whether the variation reflect true differences or random noise. Only then can you convey the narrative with conviction.