Efficiency Percentage Calculator
Calculate efficiency percentage using output or hour methods, then adjust for defects, rework, labor hours, machine hours, and the target gap.
📌Presets
🧮Efficiency Inputs
The selected method controls the primary efficiency formula.
Use planned, rated, or standard units for the same time period.
A 50% credit treats rework units as half-value output.
For the hours method, this is the numerator before quality adjustment.
The basis matters most when using the hours method.
Efficiency Results
🗂Comparison Grid
📋Efficiency Method Table
| Method | Formula | Best use | Quality adjustment |
|---|---|---|---|
| Output method | Actual output / standard output × 100 | Production, packing, picking, and other unit-based work | Use good equivalent output after defects and rework |
| Hours method | Standard hours / actual hours × 100 | Jobs where earned hours are clearer than unit count | Reduce standard hours by the quality yield factor |
| Labor basis | Standard hours / labor hours × 100 | Manual work, crews, service teams, and staffing review | Shows labor productivity after output quality loss |
| Machine basis | Standard hours / machine hours × 100 | Equipment-heavy cells and automated work centers | Highlights uptime and cycle performance |
| Combined basis | Standard hours / (labor + machine) × 100 | Mixed workflows where labor and equipment both constrain output | Use consistently across similar jobs |
🏭Process Benchmark Table
| Process type | Typical target | Common loss driver | Best gap measure |
|---|---|---|---|
| Assembly or fabrication | 90% to 100% | Changeovers, missing parts, and line balance | Good units short |
| Machining or equipment cell | 80% to 95% | Tool changes, downtime, and first-piece checks | Standard hours lost |
| Packing or bottling line | 88% to 98% | Stops, rejects, label issues, and speed loss | Units short |
| Warehouse picking or sorting | 85% to 105% | Travel path, slotting, exceptions, and recounts | Picks per hour |
| Food prep or batch production | 82% to 96% | Batch waits, trim loss, and rework | Good batches |
| Maintenance or field work | 75% to 90% | Travel, diagnosis, permits, and parts delays | Labor hours variance |
| Printing or finishing run | 85% to 97% | Setup sheets, spoilage, drying, and inspection | Accepted sheets |
| Service queue or ticket work | 80% to 100% | Reopens, escalations, and incomplete information | Completed tickets |
⚖Defect And Rework Adjustment Table
| Output status | Suggested credit | How calculator treats it | When to change it |
|---|---|---|---|
| Accepted good unit | 100% | Counts fully toward good equivalent output | Use for units that pass final inspection |
| Scrap or defect unit | 0% | Removed from good equivalent output | Use when the unit cannot be sold, shipped, or closed |
| Light rework | 70% to 90% | Counts partly because most work value remains | Use when correction time is small |
| Moderate rework | 40% to 70% | Counts partly and reduces adjusted efficiency | Use when extra labor materially affects flow |
| Heavy rework | 10% to 40% | Counts as low-value output until corrected | Use when the item nearly restarts the process |
📐Formula Breakdown Table
| Metric | Formula | Meaning | Result use |
|---|---|---|---|
| Good equivalent output | Actual output - defects - rework loss | Output after scrap and partial rework credit | Feeds quality-adjusted output efficiency |
| Output efficiency | Good equivalent output / standard output × 100 | Compares accepted work to the expected unit standard | Best for lines, batches, and repeatable unit work |
| Hours efficiency | Quality-adjusted standard hours / actual hours × 100 | Compares earned time to the time actually used | Best for crews, jobs, and mixed work content |
| Target gap | Target efficiency - adjusted efficiency | Percentage points above or below the target | Shows whether the process met the efficiency goal |
| Hour variance | Standard hours - actual hours basis | Positive means earned hours exceed actual hours | Useful for labor and machine planning reviews |
💡Efficiency Tips
A lot of inefficiencies is right under our noses. On the factory floor, you see the workers moving, you see the machines running, but something doesn’t seem right with bottom line. Usually it’s because your production plan isn’t matching up with what you’re actualy producing.
That means efficiency go beyond speed. Efficiency is a ratio of good stuff you’re producing compared to how many resource you’re using. If that ratio decrease, costs increase even though revenue remains flat.
How to Measure Factory Efficiency
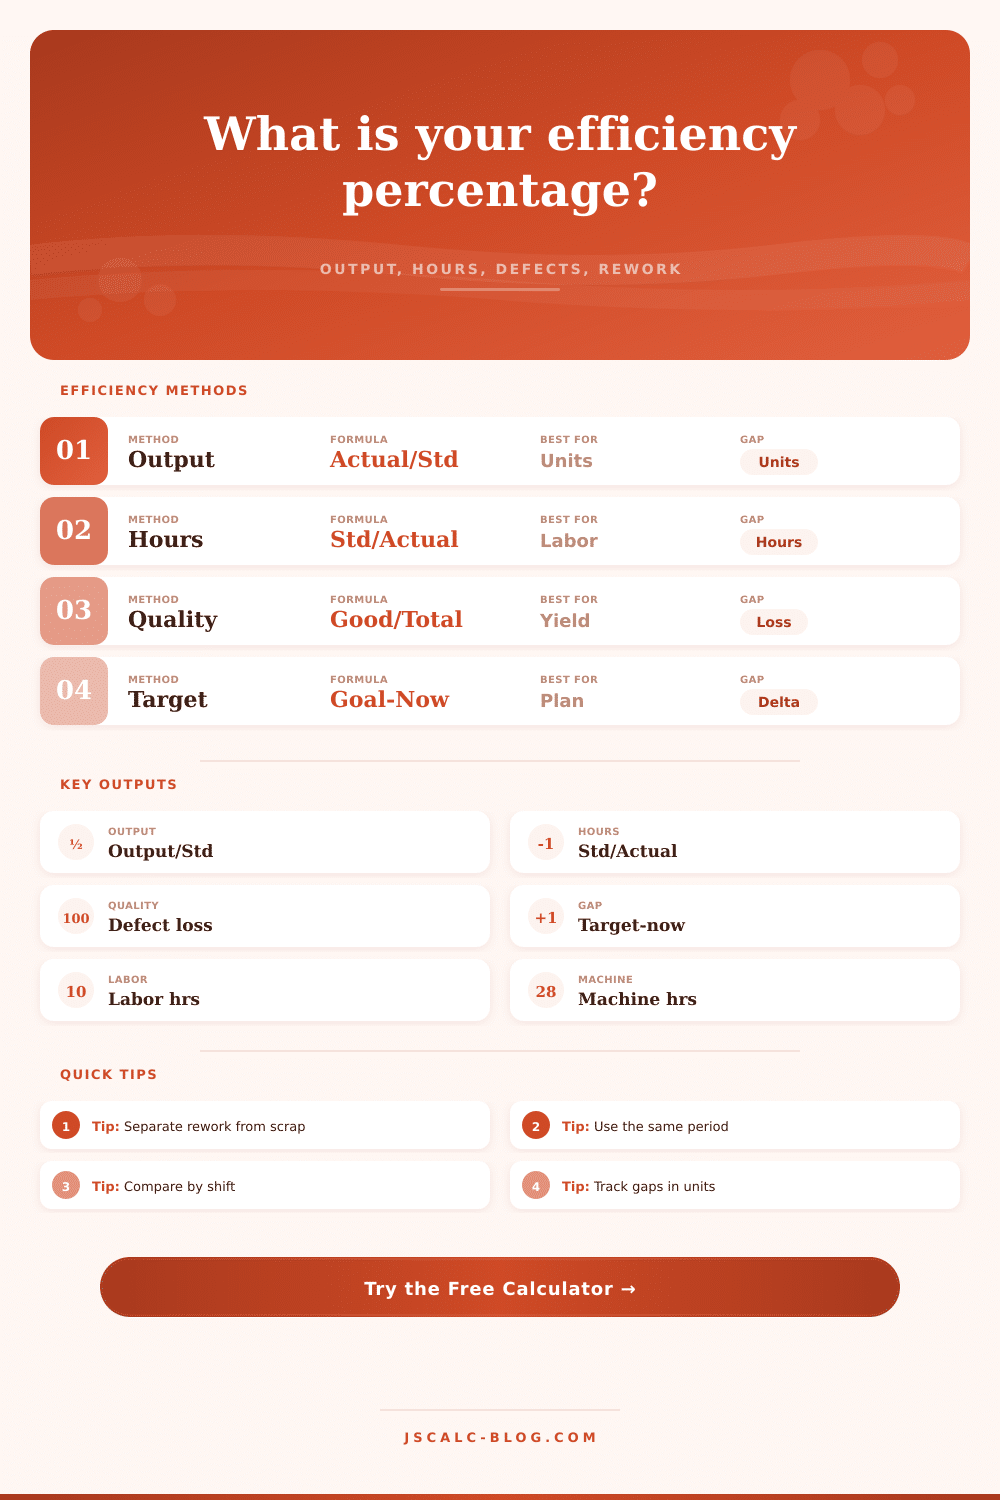
Typically, we begin with the division: Actual units/Standard units. It is a fraction. But that rarely tell the whole story. To get there, calculator does the math for you. It accounts for time, rework and defects. It also converts a raw number into usable performance metric.
Where do you draw the line when measuring efficiency? Is it measured in hours or in terms of output volume? Each tells different piece of the truth. The output method tends to make more sense if you’re running an assembly cell or a packing line. In eight hours, you know how many units you should of created. The difference is obvious when you’ve made fewer.
What about defect rate? Ten percent of your units could be flawed. That flaw may not show up in a simple calculation. Subtracting it out and applying a credit to the reworks to reflect effort involved is a smarter approach. Why? Because reworking products takes time on machines and labor but doesn’t generate additional revenue. When you treat a reworked product as fully functional, your efficiency score get inflated. Your quality problems gets masked.
The hours method is an alternative to basing things on volume. Instead, it focus on time. For complicated machining jobs or maintenance crews, this method makes more sense. These types of position have wildly varying output. You’re comparing the number of hours that you put into the job versus the number of standard hours allotted for that type of work. So if something that was supposed to take 4 hours took 6 hours, your efficiency is less than 100%.
As chart on the page shows, weightings for machine hours and labor hours can differ based off your shop’s operation. But how do you weigh it? That’s important if it’s automatic. Because if your machine are running at twice the speed of your human operator, then just measuring labor hours will bias results. You may appear very efficient on people basis. You may be drowning in idle machine time.
If you measure both machine and labor hours together, you get a more balanced picture of total resources used. And you can weight the time spent using machines. Then force yourself to consider system as a whole rather than blaming individual departments for bottlenecks.
Many numbers goes wrong at this point. When you ignore rework, you under-report. When you ignore scrap, you over-report. For the former, find a number that represents how hard you’re working on each item. A rework requiring half the time as making something new deserves a 50% credit. One requiring a full tear-down should be less. This detail makes what’s otherwise a boring number a way to check: does my loss result from speed? Is it quality? Is it wasted motion?
Gaps in targets give you direction Knowing you are at eighty-five percent efficiency is useful. That’s good information. You know you’re 10 points off your 95% target. Now you have something to work with! Exactly how much better you need to be to reach your goal.
To close this gap you’ll need to collect data regularly. Whether it’s once a month on a batch level or just one shift. What you can’t measure, you can’t improve. And if you don’t account for the hidden cost of overtime and defects, you won’t get an accurate picture.
The efficiency of your process tells you how healthy your process is. It depends on how good your equipment is and how skilled your people are. A drop on the number isn’t typically anyone’s fault. Typically, it mean something is broken somewhere along the way. And when you separate the noise from the signal, you stop guessing and can start fixing.
The metric doesn’t matter so much as the percent. You want a smooth, repeatable process where value is delivered, but waste is eliminated. That’s why the numbers exist.