Productivity Rate Calculator
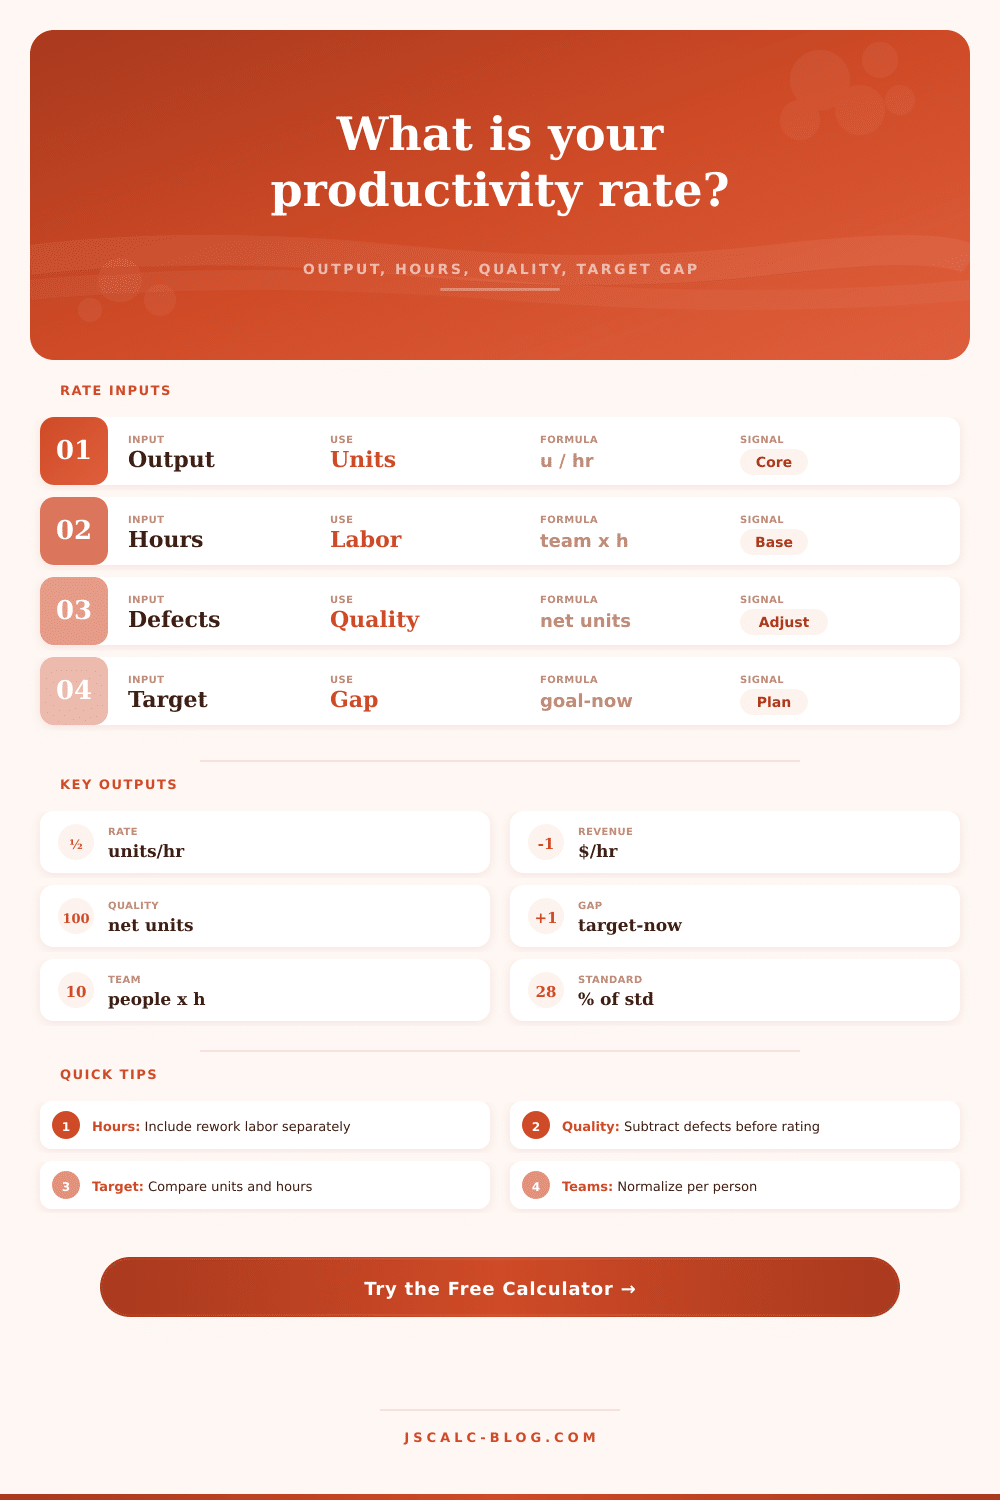
Measure output units per input hour, revenue per labor hour, defect-adjusted output, target gap, and efficiency against a standard output rate.
Sets default standard-output and target context.
Use countable units: tickets, pieces, orders, visits, jobs, or points.
Extra labor hours spent fixing defects or repeated work.
Efficiency compares adjusted productivity against this standard.
Training, standups, meetings, downtime, or admin time inside paid labor.
| Scenario | Adjusted Units | Labor Hours | Units / Hour | Efficiency | Target Gap |
|---|---|---|---|---|---|
| Current inputs | 0 | 0 | 0 | 0% | 0 |
| Metric | Formula | Best Input | What It Shows |
|---|---|---|---|
| Productivity rate | Output units / input hours | Adjusted good units | How much work is completed per labor hour. |
| Revenue productivity | Revenue / labor hour | Recognized revenue or internal value | How much value each paid hour creates. |
| Efficiency vs standard | Actual rate / standard rate x 100 | Known engineered or planned rate | Whether the process beats its expected output pace. |
| Target gap | Target output - adjusted output | Period target units | The remaining units needed to hit plan. |
| Rework share | Rework hours / total labor hours x 100 | Separate rework labor | How much capacity is being consumed by fixes. |
| Quality yield | Adjusted units / gross units x 100 | Defect or reject rate | How much output survives quality adjustment. |
| Work Category | Common Unit | Standard Rate Cue | Watch Signal | Calculator Field |
|---|---|---|---|---|
| Support queue | Resolved tickets | Tickets closed per agent hour | High reopen or escalation rate | Defect rate and rework hours |
| Manufacturing cell | Good pieces | Pieces per direct labor hour | Scrap, rejects, or rework loops | Output units and defect rate |
| Warehouse operation | Picked order lines | Lines picked per labor hour | Mis-picks and search delays | Standard output per hour |
| Content operation | Approved assets | Published items per creator hour | Revision cycles and rejects | Rework hours |
| Field service | Completed jobs | Jobs per technician hour | Return visits or callbacks | Defect rate |
| Development sprint | Accepted points | Points per engineering hour | Bug fixes inside feature time | Defect and rework adjustment |
| Adjustment | Calculator Treatment | Example | Reason To Separate It |
|---|---|---|---|
| Defect rate | Gross output x (1 - defect %) | 420 units at 4% = 403.2 good units | Prevents scrap from inflating productivity. |
| Rework hours | Added to input hours | 45 scheduled + 3 rework = 48 input hours | Captures hidden labor after first pass. |
| Paid nonproductive hours | Shown in paid-hour productivity | 48 input + 4 paid hours = 52 paid hours | Shows full capacity use beyond direct labor. |
| Target output | Target - adjusted output | 470 - 403.2 = 66.8 units short | Turns rate into a specific production gap. |
| Standard output | Actual rate / standard rate | 8.4 / 9.5 = 88.4% | Normalizes performance against plan. |
| Planning Question | Use This Output | Interpretation | Next Check |
|---|---|---|---|
| Can the current team hit plan? | Target gap and hours needed | Positive gap means more output or time is needed. | Compare added hours to overtime limits. |
| Is quality dragging the rate? | Defect units and quality yield | Low yield means gross output overstates performance. | Inspect causes of rejects and returns. |
| Is labor being consumed twice? | Rework share | High rework share means the rate is losing usable hours. | Separate preventable fixes from planned review. |
| Is the standard realistic? | Efficiency vs standard | Consistent shortfall can mean staffing, flow, or standard issues. | Compare several periods, not one snapshot. |
| Is value improving? | Revenue productivity | Higher revenue per hour can offset flat unit productivity. | Review product mix and average value per unit. |
Calculator reference prepared for JSCalc-Blog.com.
Look at a busy team. Things appear to be fine. There’s lots of motion: people typing, machines running, the floor humming with activity. Activity isn’t output. That’s the trap productivity metrics come to catch you on.
Until you actualy measure the good units that survive through the process, most managers mistake motion for progress. The truth hides in the difference between gross output and adjusted output. A thousand widgets produced in a day sounds like great throughput … except if a hundred of those widgets is defective and need to be reworked, then your true throughput is considerably less then the raw number indicates.
Why Quality Matters More Than Speed
Enter the hours, team size and defect rate into the calculator above, and it does all the math for you. You no longer has to keep track of all that hidden labor cost yourself. It makes you face reality about rework. Adding those hours of reworking to your overall input lowers the productivity rate.
And that is where people make a mistake. They don’t include the hours they spend correcting errors because they feel those are overhead hours, not direct labor hours. But effort required to fix a defect takes just as much energy as the effort needed to build it right the first time. Putting those hours in the denominator lets you see how high the true cost of poor quality is.
Another way to think about it: What’s your revenue productivity? Are you churning out units at a high volume, but are they the right units? Revenue per hour = revenue recognized / labor hours. Does your team produce value or merely move paper? If you have a support team that solves lots of tickets quickly, but those tickets is mostly low-value admin requests, then you still have flat revenue per hour. On the other hand, a smaller team could be solving complex tech questions and appear less efficient in terms of unit count, but they’re delivering higher value per hour. The context is what’s important, not the number alone.
Your benchmark is efficiency equals standard rate input. This is your best case scenario in regular conditions. This is what you should of been able to achieve if everything went right. When you compare your actual rate to that standard, does it mean you fell short? Or did you meet the plan? If you regularly fall below the standard, then maybe laziness isn’t the issue. Maybe there’s a flaw with the standard itself, maybe training, maybe tooling.
The difference between your target and your actual rate gives you a clue as to which variable has contributed most to the shortfall. A big gap between those two numbers means something is amiss. But the breakdown of causes will tell you where to go from here.
In all seriousness, you have to adjust for quality. And here’s why: Gross output sucks. It encompasses returns, scraps, and rejects. Adjusted output removes those faults. That’s how we get an accurate look into what made it past us, to the hands of the consumer.
When there are many more defects than there should be, that means you’re producing less usable stuff while spending more effort on getting there. You’ll have lower productivity rates because you’ve been working hard to create lousy results. The tool helps you split this out and determine whether or not speeding up was worth sacrificing quality. Most times, it isn’t. Taking more time to avoid mistakes usually leads to higher net output because you spend fewer hours correcting yourself.
Another key indicator is rework share. This tracks the percentage of your time that goes into doing something over again, which, if high, indicates that your system is leaking money. You’re literally paying someone to do the exact same thing twice. This is shown in the calculator as extra rework hours tacked onto the front end of input hours.
If you have to fix something, you still did work. You can’t pretend it’s not there just because it wasn’t planned. Each hour of rework is an hour you don’t get to put toward something else. These gaps tell you where you need to plan for the future.
How many more hours will it take to get there if you keep working at your pace? What’s the number in terms of “I’m behind”? That lets you know if adding staff is necessary, if you should work longer hours, if you should improve your processes. Easy: Add bodies. Hard: Improve processes. The number tells you which way to go.
Maybe you just need to switch shifts. Or maybe you’ve got a structural issue. Speed isn’t everything. Efficiency, how much value we create compared to the resources we consume, that’s what productivity is all about.
Numbers come from the calculator; judgment comes from you. Let the findings inform tweaks to your workflows. Cut down on defects. Match efforts with revenue. Don’t go faster just to go faster. Go better. Focus on quality, not quantity.
Busyness isn’t a goal. Effectiveness is. And when you measure properly, the way forward becomes clear. You will not have to guess anymore. You will no longer manage things by winging it. Doing the math?