Labor Cost Percentage Calculator
Compare total labor cost, labor cost percentage, productive versus nonproductive labor, contractor mix, burden rate, and target variance for the same revenue period.
📌Scenario Presets
📝Labor Cost Inputs
All money inputs should use this same period.
Direct service, production, billable, or revenue-supporting labor.
Labor Cost Results
🧾Cost Mix Snapshot
📊Comparison Grid
Use this grid to compare the current labor percentage with revenue growth, labor changes, and target labor levels.
| Scenario | Revenue | Labor Cost | Labor % | Target Gap | Change vs Now |
|---|---|---|---|---|---|
| Current inputs | - | - | - | - | - |
📘Labor Percentage Benchmarks
| Business Type | Common Labor % Range | Example Target | Productive Labor Focus | Watch Item |
|---|---|---|---|---|
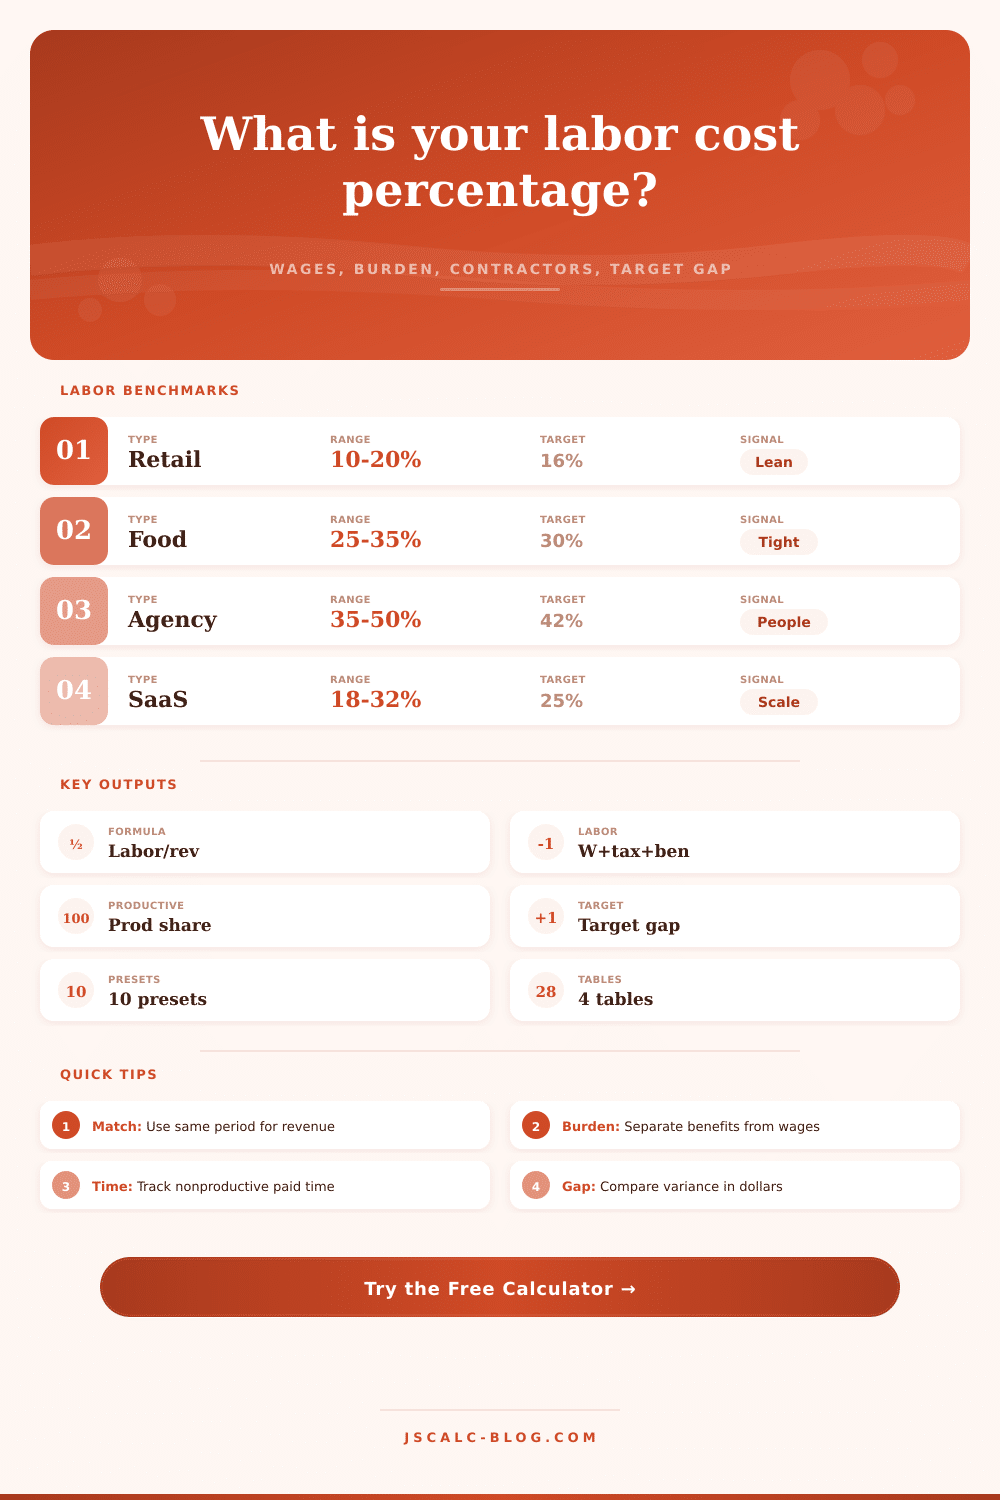
| Restaurant / food service | 25% to 35% | 30% | Kitchen, bar, floor service | Schedule creep during slow revenue periods |
| Retail store | 10% to 20% | 16% | Selling floor and fulfillment | Payroll staying fixed while traffic drops |
| Agency / professional services | 35% to 50% | 42% | Billable delivery time | Admin hours and write-downs |
| SaaS support / customer success | 18% to 32% | 25% | Support, onboarding, success work | Headcount added before revenue catches up |
| Clinic / care team | 22% to 38% | 31% | Patient-facing clinical labor | No-show periods and overtime |
| Construction / field crew | 20% to 40% | 32% | Field production hours | Idle mobilization, weather, rework |
| Hotel / hospitality | 18% to 30% | 24% | Rooms, front desk, guest service | Low occupancy with fixed staffing |
| Warehouse / fulfillment | 12% to 24% | 18% | Pick, pack, receiving labor | Nonproductive waiting and rework |
🔧Component Method Table
| Component | What To Include | Formula Role | Common Review |
|---|---|---|---|
| Employee wages and salaries | Regular pay, overtime, bonuses tied to work | Base labor cost | Compare scheduled hours to revenue demand |
| Payroll taxes | Employer payroll taxes and statutory burden | Add to total labor | Check tax burden as a percent of wages |
| Benefits and insurance | Health, retirement, paid leave accrual, insurance | Add to total labor | Separate recurring burden from one-time items |
| Contractor labor | Freelancers, temp staff, subcontracted labor | Add to total labor | Compare flexibility against margin dilution |
| Productive labor | Direct, billable, production, or service time | Total labor x productive % | Measure the share of labor tied to output |
| Nonproductive labor | Paid admin, training, idle time, rework | Total labor - productive labor | Track patterns, not just one period |
🎯Target Variance Reference
| Variance Signal | Percentage Gap | Dollar Gap Meaning | Typical Action |
|---|---|---|---|
| Under target | Below 0 pts | Labor is below target allowance | Check service quality and backlog before cutting further |
| On target | 0 to 2 pts | Labor is close to planned revenue mix | Keep schedule and productivity reviews consistent |
| Moderate overage | 2 to 5 pts | Labor is drifting above target allowance | Review hours, overtime, contractor usage, and sales mix |
| High overage | Over 5 pts | Labor is materially above target allowance | Separate revenue shortfall from staffing or productivity issues |
💡Practical Tips
The majority of business owners has trained themselves to think of people as a line item on their income statement that should of being reduced whenever possible. It seems like common sense: When margins are squeezed, reduce hours. But this is a dangerous mistake because it ignores the difference between total labor cost and actual productive output.
We’re measuring total labor cost. It’s tempting to assume that reducing price of labor will increase profitability, but truth is that you can reduce payroll dollars while simultanously destroying the customer experience that drives revenue. A labor cost percentage calculator are a tool to help you understand what’s happening in its entirety.
How to Calculate Real Labor Costs
It shows how much each staff member costs (wages + taxes + benefits + contractors’ fees), and then you can compare that number to your sales. This perspective allow you to avoid getting caught in a trap. Instead of optimizing for low-cost labor, you can focus on high-quality service and long-term operational stability.
To start, lets define total labor. For most managers, that means gross wages. They believe this is what they have control over, when in fact it’s not. The burden are everything else: payroll taxes, paid leave, health insurance, and retirement contributions. Leave any one (or more) of these out, and your percentage appears artificialy low.
Bad decision time. By giving the calculator all of these layers, it do the math for you so you can actualy see how much cash goes out the door. Why? Because there’s often a massive difference between perception and reality, a restaurant may be lean with wages at twenty percent, but then hit thirty-five percent when you factor in the hidden costs of tax and benefits. It’s here that restaurants loses their money.
The second key input is separating out productive vs. This is nonproductive labor. That’s the time that people spends building something (assembling a product, writing code for a feature, etc.) and the time they’re not doing so. These include rework, idle time, admin work, and training. These tasks is all nonproductive.
The tool breaks this down into its share of your total payroll, letting you see exactly what portion of your employees’ time are linked to production. Generally speaking, the higher the productive share the better, although very high can be a red flag; you may be under-resourcing in support roles which causes more errors and burnout. You want just the right amount so that the folks who generate revenue stay focused on doing that.
Compare your numbers to industry standards. Twenty percent labor could be fine for a retail store, but it’d be horrendously low if you’re a creative agency, people is your main product. Generally speaking, agencies tend to hover around thirty-five to fifty percent (see the reference table on the page). It’s easy to make an apples-to-oranges comparison against another industry’s benchmark, which will either unnecessarily panic you or dangerously lull you into complacency. You have to know where you should be in order to assess where you are.
The last piece to the puzzle is variance analysis. This show you exactly where you are off-target (both in terms of actual dollars and in percentage points). You may think that a 2% difference doesn’t seem like much, but that’s thousands of dollars in margin lost for the quarter! Or, maybe you’re seeing huge swings on a slow month. Even if there was a big percentage gap, the dollars weren’t much so you can let it go.
Variance gives you the ability to see early trends. Are your labor costs increasing while your revenue remains stagnant? Then you’ve got a productivity problem. Is your revenue decreasing while your labor remain constant? Then you’ve got a demand problem. And each calls for a different fix.
Labor management isn’t a game of nickeling and diming until you hit rock bottom. Labor management is about matching your staff to your potential revenue. That means sufficient staff to get the job done while avoiding the expense of downtime. This can be complicated math. But the calculator boils it down… The strategy comes from knowing what the numbers mean in terms of your own business.
Track both the total burden and the productive share. And avoid falling into the trap of simplistic payroll management. Every hour should count towards the bottom line, and you must know precisely what you’re paying for.