Full-Time Equivalent Calculator
Convert employee hours into FTE for weekly, monthly, quarterly, annual, or custom reporting periods with part-time groups and optional overtime exclusion.
📌FTE Presets
⚙Workforce Inputs
Sets the period used for total FTE and hour conversions.
Common examples are 35, 37.5, 38, or 40 hours.
Monthly default uses 52 weeks divided by 12 months.
Exclude overtime when FTE should reflect staffing level, not workload pressure.
Each full-time employee is counted at one standard schedule.
Use zero if the report counts paid leave as active hours.
Group employees with similar weekly schedules.
Added only when overtime treatment is set to include.
Used for gap analysis in the results card and breakdown.
FTE Breakdown
🗂Comparison Grid
📋Weekly, Monthly, and Annual FTE Table
| Weekly Hours | FTE at 40 Hours | Monthly Hours | Annual Hours | Planning Use |
|---|---|---|---|---|
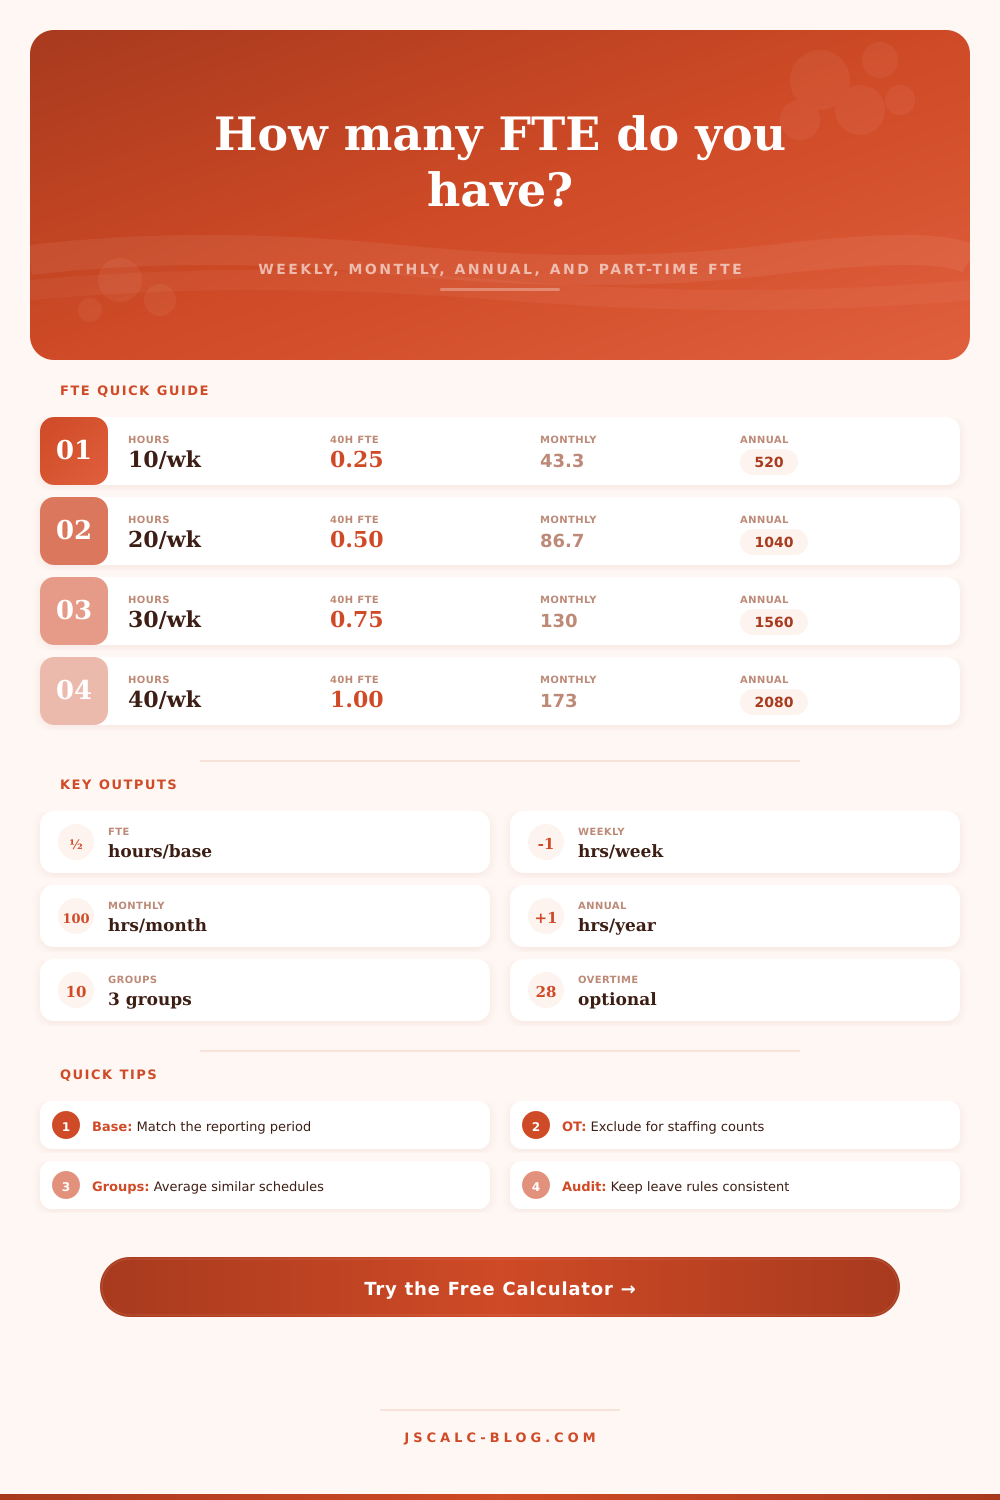
| 10 hours | 0.25 FTE | 43.3 hours | 520 hours | Small recurring support schedule |
| 15 hours | 0.38 FTE | 65.0 hours | 780 hours | Light part-time coverage |
| 20 hours | 0.50 FTE | 86.7 hours | 1,040 hours | Half-time employee or shared role |
| 25 hours | 0.63 FTE | 108.3 hours | 1,300 hours | Regular reduced schedule |
| 30 hours | 0.75 FTE | 130.0 hours | 1,560 hours | Large part-time or benefits threshold review |
| 35 hours | 0.88 FTE | 151.7 hours | 1,820 hours | Near full-time schedule in a 40-hour base |
| 40 hours | 1.00 FTE | 173.3 hours | 2,080 hours | Standard full-time employee |
📅Standard Full-Time Hours by Period
| Period | Weeks Used | Standard at 40h | Formula | When to Use |
|---|---|---|---|---|
| Weekly | 1 | 40 hours | 40 × 1 | Scheduling, payroll review, and roster balancing |
| Monthly | 4.333 | 173.3 hours | 40 × 52 / 12 | Management reporting and average monthly staffing |
| Quarterly | 13 | 520 hours | 40 × 13 | Grant reports, hiring plans, and workforce reviews |
| Annual | 52 | 2,080 hours | 40 × 52 | Budgeting, headcount planning, and yearly benchmarks |
| Custom | User-entered | Varies | Weekly standard × weeks | Seasonal blocks, fiscal periods, or partial-year models |
👥Part-Time Group Examples
| Group Scenario | People | Weekly Hours Each | Total Weekly Hours | FTE at 40h | Interpretation |
|---|---|---|---|---|---|
| Two half-time coordinators | 2 | 20 | 40 | 1.00 | Same FTE as one full-time schedule |
| Four weekend staff | 4 | 12 | 48 | 1.20 | More than one FTE spread across four employees |
| Six school aides | 6 | 25 | 150 | 3.75 | Useful for grant and staffing allocation reports |
| Ten seasonal workers | 10 | 15 | 150 | 3.75 | High headcount can still be moderate FTE |
| Three reduced schedules | 3 | 32 | 96 | 2.40 | Close to full-time load without three full FTE |
| Mixed contractor pod | 5 | 18 | 90 | 2.25 | Converts fractional coverage into one staffing number |
⏱Overtime Treatment Table
| Reporting Goal | Overtime Setting | What It Shows | Example Effect | Best Check |
|---|---|---|---|---|
| Staffing headcount | Exclude overtime | How many standard full-time schedules the workforce represents | 120 extra hours do not inflate FTE | Hiring plan or benefits report |
| Workload demand | Include overtime | How many full-time schedules were needed to cover all worked hours | 120 extra hours add 0.69 monthly FTE at 40h | Capacity pressure and burnout review |
| Compliance snapshot | Use policy rule | Matches the definition requested by the report owner | May differ from operating FTE | Document the denominator and period |
| Forecast model | Run both ways | Shows the staffing gap between actual hours and normal schedules | Difference becomes overtime dependency | Compare before approving new roles |
📐Formula Method
💡FTE Tips
And now you’re staring at a spreadsheet making no sense whatsoever. You have six part-time assistants working twenty hours. And then you have a dozen full-time coordinators. You also has another four weekend staff member working twelve hours each. So, on paper, it’s twenty-two people. But your budget got approved with funding for only twenty positions. This is the kind of gap we get into as humans between our headcount and how much work actualy needs to be done. How do we reconcile this?
FTE stands for Full-Time Equivalent. It may feel like a number for grant reporting purposes only. But honestly, it’s the only true method of measuring someone’s actual labor capacity. Once you enter your own numbers (weekly hours; reporting period), the calculator above does all the fraction-division for you. No need to waste brain power figuring it out by hand. There are 00 FTE. Twenty hours of work represent precisely one-half of this workload. Why? What’s the magic here? It is mostly just knowing what you’re actualy measuring.
What Is FTE and Why It Matters
Capacity isn’t headcount. You don’t count heads. Instead, you combine the part-timers with full-timers. You may have twenty employees on payroll, but because half of them work reduced schedules, you really has only ten FTEs to get job done. That makes a world of difference during budgeting season where you need to argue for adding another person to the team, or explain why the team is worn-out and needs some time off.
The other source of confusion is the way reporting period doesn’t line up neatly with our understanding of weeks and months. A year has 52 weeks. But 12 months. So there are four days left over. Ignoring that fraction leads to compounding errors in your annual projections when you use simple mental math. When we divides 52 weeks into 12 months, we come out with ~4.33 weeks per month. Round that down to 4 weeks and you’ve got a compounding error in the projection across a full year. The tool doesn’t make that mistake: it uses the exact fraction instead. That tiny decimal adds up to nearly 30 extra hours of expected work per month per employee if you miss that buffer!
Your quarterly reports will look as though you’re overstaffed. You’ll be counting the wrong thing.
The second important lever is the overtime policy. Here’s where FTE concept splits into two varieties. Measured without overtime, it tells you your “normal” staff size. How many full-time staff schedules can your team support under typical circumstances? That’s what you report for compliance and benefits purposes. But measured with overtime, it tells you about demand. How much work did you really have to do, no matter where that labor came from (regular hours vs. Overtime)? The latter provides an indicator of capacity stress. When the workload FTE exceed the staffing FTE by a wide margin, you’re banking on burnout to sustain operations.
To keep this math clean, group part-timers based off similarly-scheduled jobs. If ten people each put in 15 hours per week, there’s no need to list each person separately: just group them for simplicity while retaining accuracy. This also shows where the labor is concentrated. High headcount and low FTE means a bunch of part timers (perhaps difficult to manage). Low headcount but high FTE mean lots of extended shifts or overtime (increasing risk of retention issues). The reference table below on that page explain the most-common conversions so you can pick up on any patterns fast.
FTE ultimately is a translation tool. It is a way to take the messy world of different overtime, leaves, and schedules and turn it into one number that talks about capacity. The math may not be everyone’s favorite thing. But even if you don’t like it, I think you’ll understand its clarity. If you have your actual full-time staff count, you no longer guess if you need more people or simply better scheduling. You begin to treat labor as a resource instead of something measured in headcount. And when we can see this clearly the next budget meeting becomes a bit easier than the ears.