Capacity Utilization Calculator
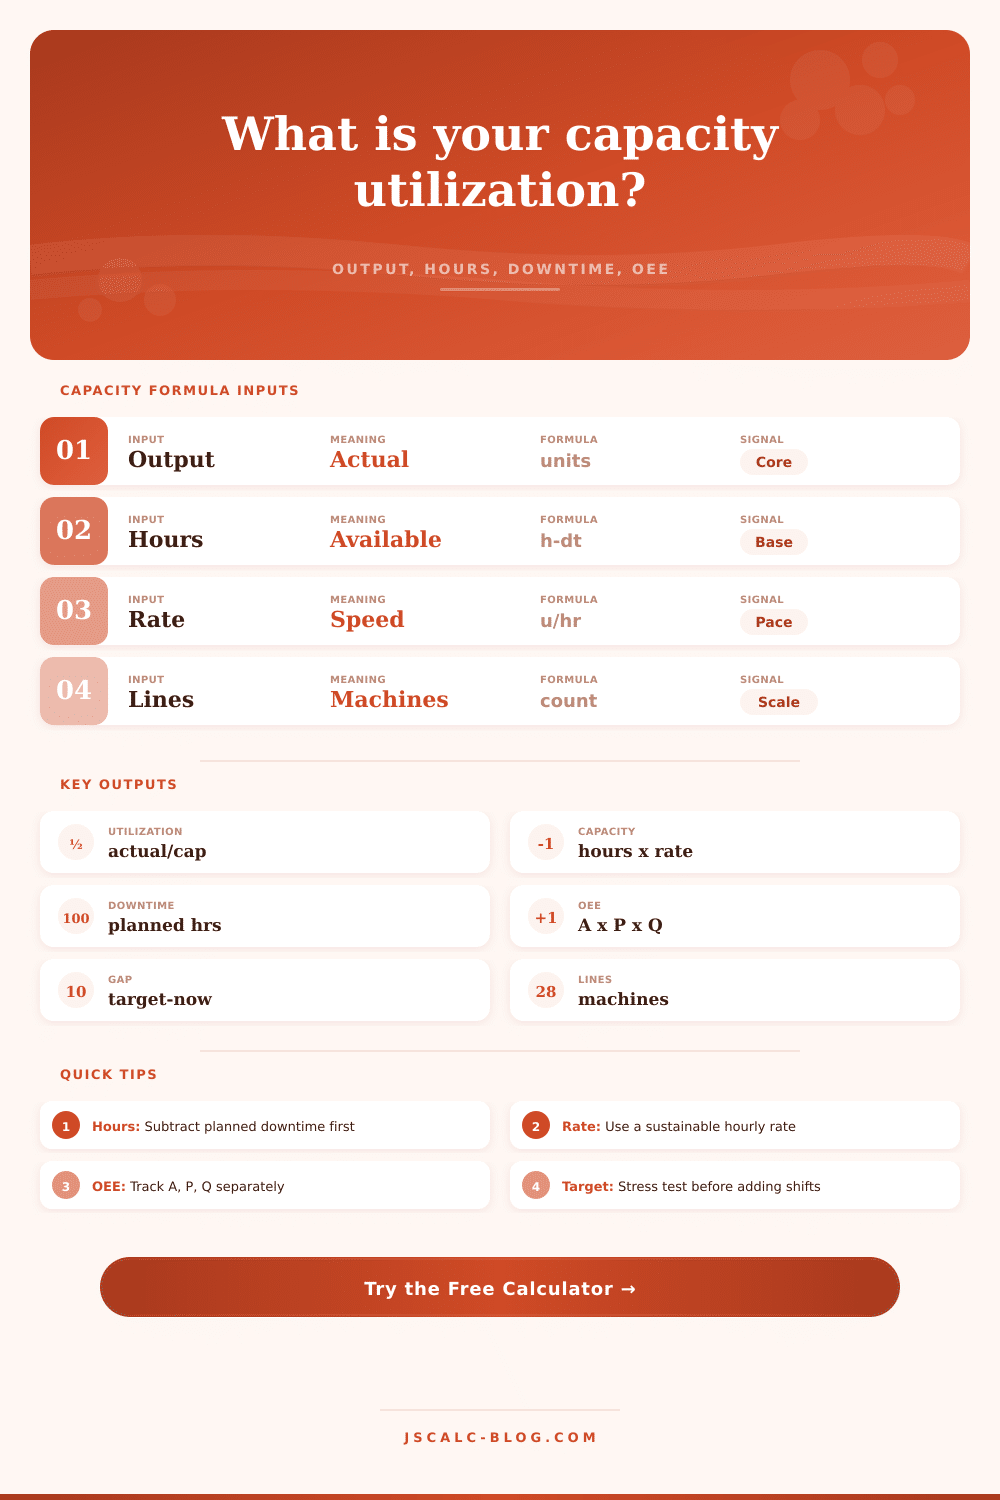
Calculate capacity utilization from actual output, available production hours, units per hour, lines or machines, planned downtime, and optional OEE availability, performance, and quality.
Sets target band and reference notes for the selected operation.
Use good output for the same period as the capacity inputs.
Maintenance, sanitation, changeover windows, planned meetings, or blocked capacity.
Used for an observed runtime view; planned capacity stays tied to planned downtime.
| Scenario | Available Hours | Potential Capacity | Utilization | Target Gap | OEE View |
|---|---|---|---|---|---|
| Current inputs | 0 | 0 | 0.0% | 0 | 0.0% |
| Metric | Formula | Use This Input | What It Shows |
|---|---|---|---|
| Scheduled hours | Days x shifts x hours | Calendar plan | Total clock hours before planned losses. |
| Available hours | Scheduled hours - planned downtime | Planned production window | Capacity time that should be available to produce. |
| Potential capacity | Available hours x units/hour x lines | Rated sustainable rate | The denominator for capacity utilization. |
| Utilization | Actual output / potential capacity x 100 | Good output | How much of planned production capacity was used. |
| Observed runtime | Available hours - unplanned downtime | Downtime log | Actual running time after breakdowns or interruptions. |
| OEE factor | Availability x performance x quality | OEE percentages | Optional effective capacity view beside planned capacity. |
| Operation | Usual Unit | Useful Range | Watch Point | Best Denominator |
|---|---|---|---|---|
| Discrete assembly | Finished units | 70% to 90% | Starved stations and line imbalance | Available production hours |
| Packaging line | Cases or packs | 65% to 88% | Changeovers and sanitation windows | Net planned line time |
| Machining cell | Good parts | 75% to 92% | Setup time and tool changes | Machine available hours |
| Process plant | Batches or tons | 80% to 95% | Quality holds and cleaning cycles | Rated process hours |
| Print or label room | Jobs or impressions | 60% to 85% | Queue mix and makeready time | Press available hours |
| Service seats | Completed contacts | 70% to 88% | Queue volatility and offline work | Staffed productive hours |
| Warehouse dock | Orders or pallets | 65% to 90% | Dock door peaks and wave timing | Door or crew available hours |
| Healthcare stations | Visits or sessions | 70% to 86% | No-shows and cleaning turnover | Bookable station hours |
| OEE Layer | Entered As | Calculator Treatment | Common Cause |
|---|---|---|---|
| Availability | 0% to 100% | Effective capacity x availability | Breakdowns, waiting, unscheduled stops |
| Performance | 0% to 150% | Effective capacity x performance | Speed losses, minor stops, rate changes |
| Quality | 0% to 100% | Effective capacity x quality | Scrap, rework, rejects, holds |
| OEE capacity | A x P x Q | Potential capacity x OEE factor | Effective capacity under actual operating conditions |
| OEE utilization | Actual / OEE capacity | Shown beside the standard utilization formula | Explains whether losses are capacity or execution related |
| Utilization Band | Signal | Capacity Planning Meaning | Next Check |
|---|---|---|---|
| Below 60% | Underloaded | Fixed assets or labor may be idle for the period. | Check demand timing and staffing plan. |
| 60% to 75% | Light load | There is room to absorb work without schedule pressure. | Review planned downtime and order mix. |
| 75% to 90% | Balanced | Capacity is being used while retaining recovery margin. | Track bottlenecks before adding demand. |
| 90% to 100% | Tight | Small interruptions can create backlog or missed dates. | Test overtime, extra line time, or sequencing. |
| Above 100% | Over capacity | Actual output exceeds entered planned capacity. | Verify rated speed, available hours, or hidden capacity. |
Calculator reference prepared for JSCalc-Blog.com.
Just because there’s a lot going on doesn’t necessarily mean you are getting more done. You might have busy machines with bodies moving around the floor, but the inventory isn’t growing quickly. Usually this means they don’t understand their capacity.
What we think of as capacity is simply “the lights-on-hours.” No. Capacity is time available for making good product. It is the time used to make good product. But once you input what you’re doing, the calculator above do the work for you. No more wild guesses on conversion rates!
How to Calculate Real Factory Capacity
So how do you start? How do you define the denominator? That’s where most operations stumble.
Before determining possible capacity, remove planned downtime. This includes anything scheduled like a changeover, a sanitation break, or an afternoon of maintenance. Keep these hours in the equation and you’ll have a artificially low utilization percentage. You’re penalizing yourself for needed housekeeping. Without them, you get a clear view of your actual production window.
Now enter the rated speed per line. This is the speed that is feasible to maintain. Do not use some theoretical maximum that dies out in 10 minutes. An unrealistic speed bloats capacity estimates and makes actual output seem bad. Better to have a feasible pace that are consistently met.
Then allow it to account for your Overall Equipment Effectiveness factors such as quality, performance, and availability. These are the percentages which explain why you ship less different than what was planned. You might have a high utilization figure but with severe quality problems. If you don’t take into consideration this layer of things then….
Here’s what normal use rates look like for various industries (from this reference table):
Discrete manufacturing (Efficiently operating between 70-90% (i).e. This means running the whole line.
Process plant, Large fixed costs, may be able to push higher
The service desk depends on human availability.
So if you know what’s “normal” for your industry, then you won’t waste time with vanity metrics. You don’t want to be running your discrete assembly line at a ninety-five percent use rate. That’s dangerous. If there’s an equipment glitch, a rush order, someone calls out sick, there’s no buffer and the impact ripples through the rest of the schedule.
Now, stress test your numbers. What happens if you add unplanned downtime? What happens if you increase or decrease your shift count? Often, when you start putting on the screws, your margin vanish in a hurry.
That’s where the target gap metric comes in. It tells you precisely how many units you have to produce to reach your goal. It takes an abstract percentage and makes it a concrete production target. If the gap exceeds what can be closed with existing resources, then re-think your equipment or staff investment.
A lot of managers view utilization as a static, solitary number. In reality, it’s a dynamic diagnostic. If your use is low, that could be an indication you require additional sales. If your use is high, that could be an indication you require additional machines.
The key is knowing what you’re measuring. Is this a measure of how effectively the operator is functioning or a measure of how much time machine is running?
Don’t get paralyzed by needing to collect perfect information. It is better to use realistic estimates that include maintenance than to use accurate numbers that ignore it. You should of used more lifelike data. Your starting point is what’s already in place. Figure out what’s leaking the most, and plug the holes.
There’s no need to squeeze every last ounce of efficiency from each minute. Just recognize where you’re losing value. Get your actual output to match what you are truly capable of doing.
Then the floor makes sense once more. The noise dissapears. The signal emerges.
And then you realize it’s not that you’re just slaving away, you’re working right.