Takt Time Calculator
Calculate takt time from available production time and customer demand, then compare units per hour, cycle time fit, staffing need, period demand, and capacity risk.
🎯Takt Time Presets
🧮Time, Demand, And Cycle Inputs
Profiles set interpretation and default staffing buffer only.
Demand is the customer pull for the selected period.
Use finished demand, not forecasted starts or internal batch quantity.
For weekly demand, enter total planned shifts in that week.
Include planned maintenance, sanitation, tool checks, or planned line stops.
Use the bottleneck or balanced-cell cycle time, including normal work content.
Adds staffing headroom for variation, minor imbalance, and coverage.
Inflates required gross production when scrap or rejects reduce finished units.
📌Comparison Grid
🗂Planning Profile Grid
📊Scenario Comparison Table
| Scenario | Available Time | Demand | Takt Time | Units / Hour | Staff Needed | Signal |
|---|---|---|---|---|---|---|
| Current inputs | 0 min | 0 | 0 sec | 0 | 0 | Enter inputs |
📅Demand By Period Table
| Period View | Equivalent Demand | Available Time | Required Rate | Use |
|---|---|---|---|---|
| Shift | 0 units | 0 min | 0/hr | Line balance |
📘Takt Method Table
| Metric | Formula | What To Enter | What It Shows |
|---|---|---|---|
| Available production time | Shift time - breaks - downtime - meetings - changeover | Only planned net time in the demand period. | The time customer demand can actually consume. |
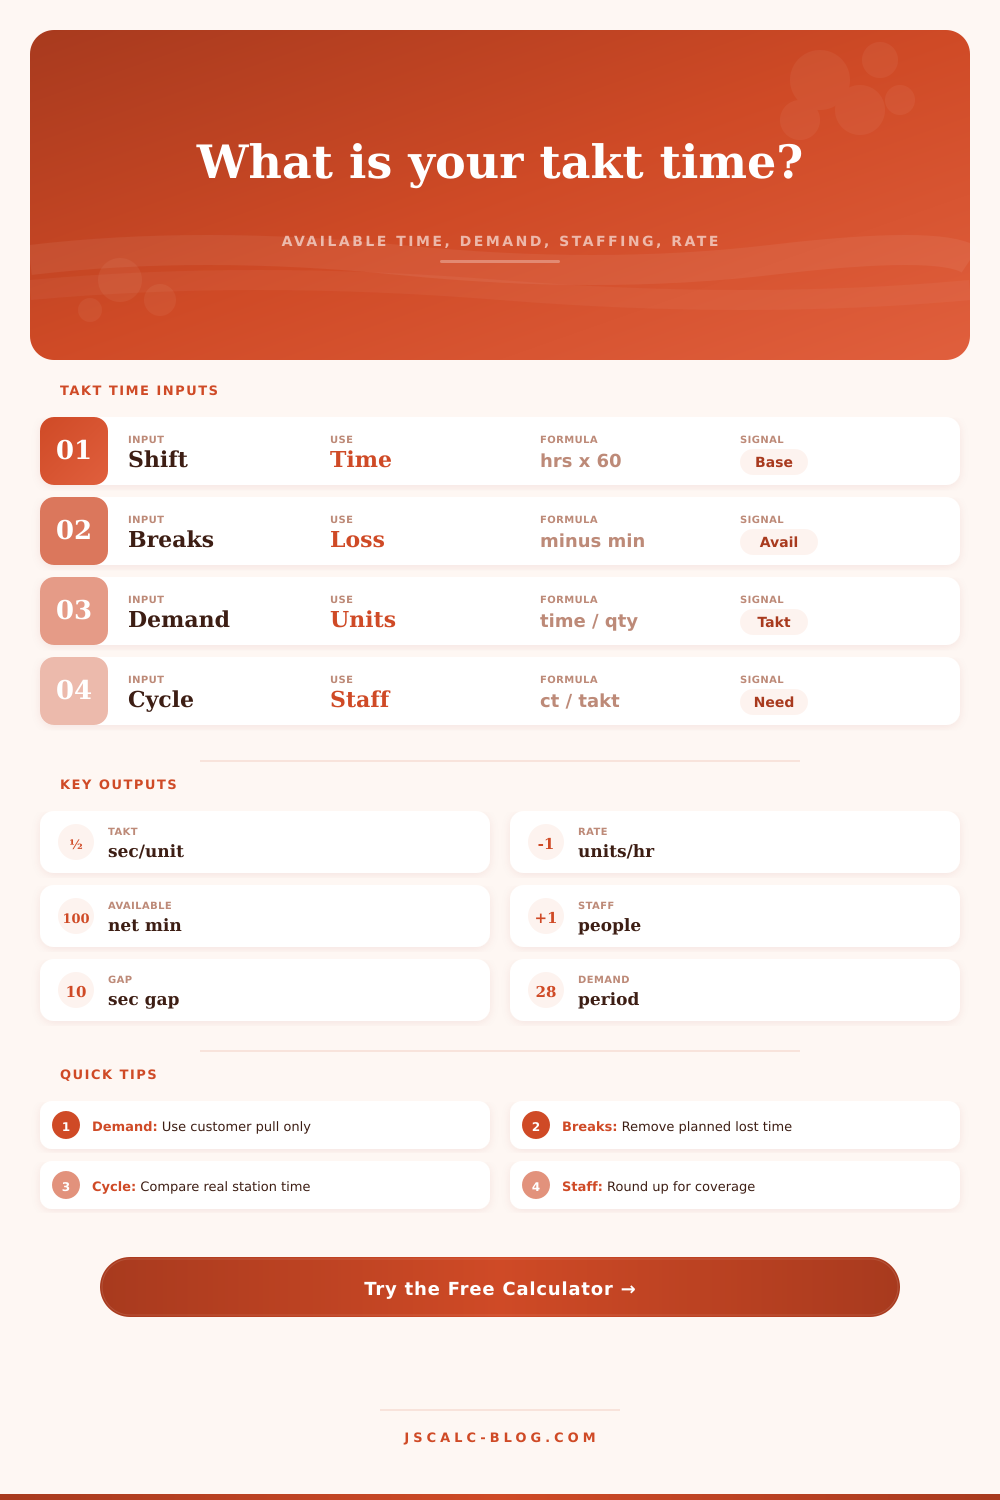
| Takt time | Available production time / customer demand | Finished customer demand for the same period. | The maximum seconds available for each finished unit. |
| Units per hour | Customer demand / available hours | Demand and net available hours. | The hourly pace required to meet customer pull. |
| Staffing need | Cycle time / takt time | Observed bottleneck cycle time in seconds. | Operators needed before rounding and buffer. |
| Yield-adjusted demand | Customer demand / yield | Expected good output percentage. | Gross units required when not every unit passes. |
⚙Loss And Staffing Reference Table
| Planning Item | Typical Treatment | Calculator Field | Check Before Acting |
|---|---|---|---|
| Paid breaks and lunch | Subtract from available time. | Break minutes per shift | Keep the same policy across all shifts. |
| Daily huddle or safety talk | Subtract when the line is not producing. | Meeting minutes per shift | Separate production-side huddles from office meetings. |
| Planned maintenance | Subtract if it stops production during the period. | Planned downtime minutes | Do not mix unplanned outage loss with takt time. |
| Changeover and sanitation | Subtract when product flow is unavailable. | Changeover or admin minutes | Use average minutes per shift or per demand period. |
| Cycle time slower than takt | Add labor, split work, or remove work content. | Observed cycle time | Confirm the bottleneck before changing staffing. |
| Yield below 100% | Raise gross units needed for finished demand. | Good output yield | Track scrap separately from planned time losses. |
🔢Formula And Method Breakdown
💡Takt Time Tips
The space between customer demand and wall clock time is called takt time. A typical manager think he has 8 hours of work time (e.g., 480 minutes per shift). In reality, there are breaks, changeover times, and maintenance issue. Unless you understand how many minute you have to make things, you won’t be able to satisfy demand. That’s where missed deadlines and understaffing come from.
The word is takt time, a German concept meaning rhythm or beat. Within the context of lean manufacturing, it’s the speed at which you need to run in order to make exactly what the customer needs on time. For example, if you’re making 420 units per shift, then you have to do it at that rate. Run faster and you’ll be creating waste; run slower and you’ll be creating backlogs.
What Is Takt Time?
Input your constraints into calculator and it will do the rest. That takes the guesswork out of planning how much you can make, removing all of planned downtime.
Time is tough to calculate. How much time do you have? Most team don’t account for sanitation time of equipment. They don’t count time needed for safety huddles. That’s minutes they lose. Count those minutes into your total time and you’ll have a longer takt time then you actualy have. So, you’ll feel like you have all this time yet end up rushing at the end of shift. Separately inputting downtime and breaks helps prevent loss hiding in overhead. It makes you realize time cleaning isn’t time building.
Then you break it down by time based off what the customer requires. Divide this by the available time. And there you are: your max time per unit. All of your station should work within this timeframe.
Anything that exceeds this is a bottleneck. It’s the slowest station. Everything else slow down to meet the pace of that station. You will now be producing less than the market requires. That station’s inventory builds. Downstream stations twiddle their thumbs. It’s less efficient.
Math also go wrong when calculating how many people to employ. You figure out that you need 2.5 operators? Well, no, you can’t have half a person. Then round up to cover delays, breaks, and other issue. Add a buffer to account for differences in workers’ speeds. On some days it takes longer; sometimes one operator is faster than another. If you ignore these variations, your product won’t always be as good, and your operators will get burned out. More buffer is required on a repair bench vs. An automated assembly line because the work content vary wildly. It is a repair bench where work doesn’t vary moddernly.
The other factor that’s considered is yield. Perhaps 2% of what you make ends up as scraps. In that case, you need to begin with a quantity larger than what the customer ordered. To account for this, the calculator increases the demand accordingly so that number of good items that are produced is equal to order size. If you skip this step, you’ll end up short delivering on the order. You should of accounted for it.
Production speed is guided by takt time. Too fast, and it’s hard for the system to work. Too slow, and things drag to a halt. You’re trying to meet the beat of the market. Production flows better when the market use the time you have available. It’s no longer emergency reaction, it’s deliberate action. The clock keeps ticking, but now it’s ticking in time with you.