Cycle Time Calculator
Measure net cycle time, good-unit cycle time, throughput, station load, setup burden, downtime loss, and takt time gap from one production run.
Used for the benchmark signal and default target guidance.
Examples: units, cases, orders, parts, tickets.
Completed output from the same production window.
Used to allocate setup time and show batch cycle burden.
Takt time = available customer time / customer demand.
| View | Time Basis | Unit Basis | Cycle Time | Throughput | Takt Read |
|---|---|---|---|---|---|
| Current | Net production | Produced units | 0 | 0 | Enter inputs |
The comparison grid separates pure production pace from quality-adjusted pace and all-in calendar burden.
| Scenario | Net Minutes | Produced Units | Good Units | Cycle Time | Good-Unit Cycle | Throughput / hr | Takt Gap | Station Load |
|---|---|---|---|---|---|---|---|---|
| Current inputs | 0 | 0 | 0 | 0 | 0 | 0 | 0 | 0% |
| Metric | Formula Used Here | What It Answers | Planning Note |
|---|---|---|---|
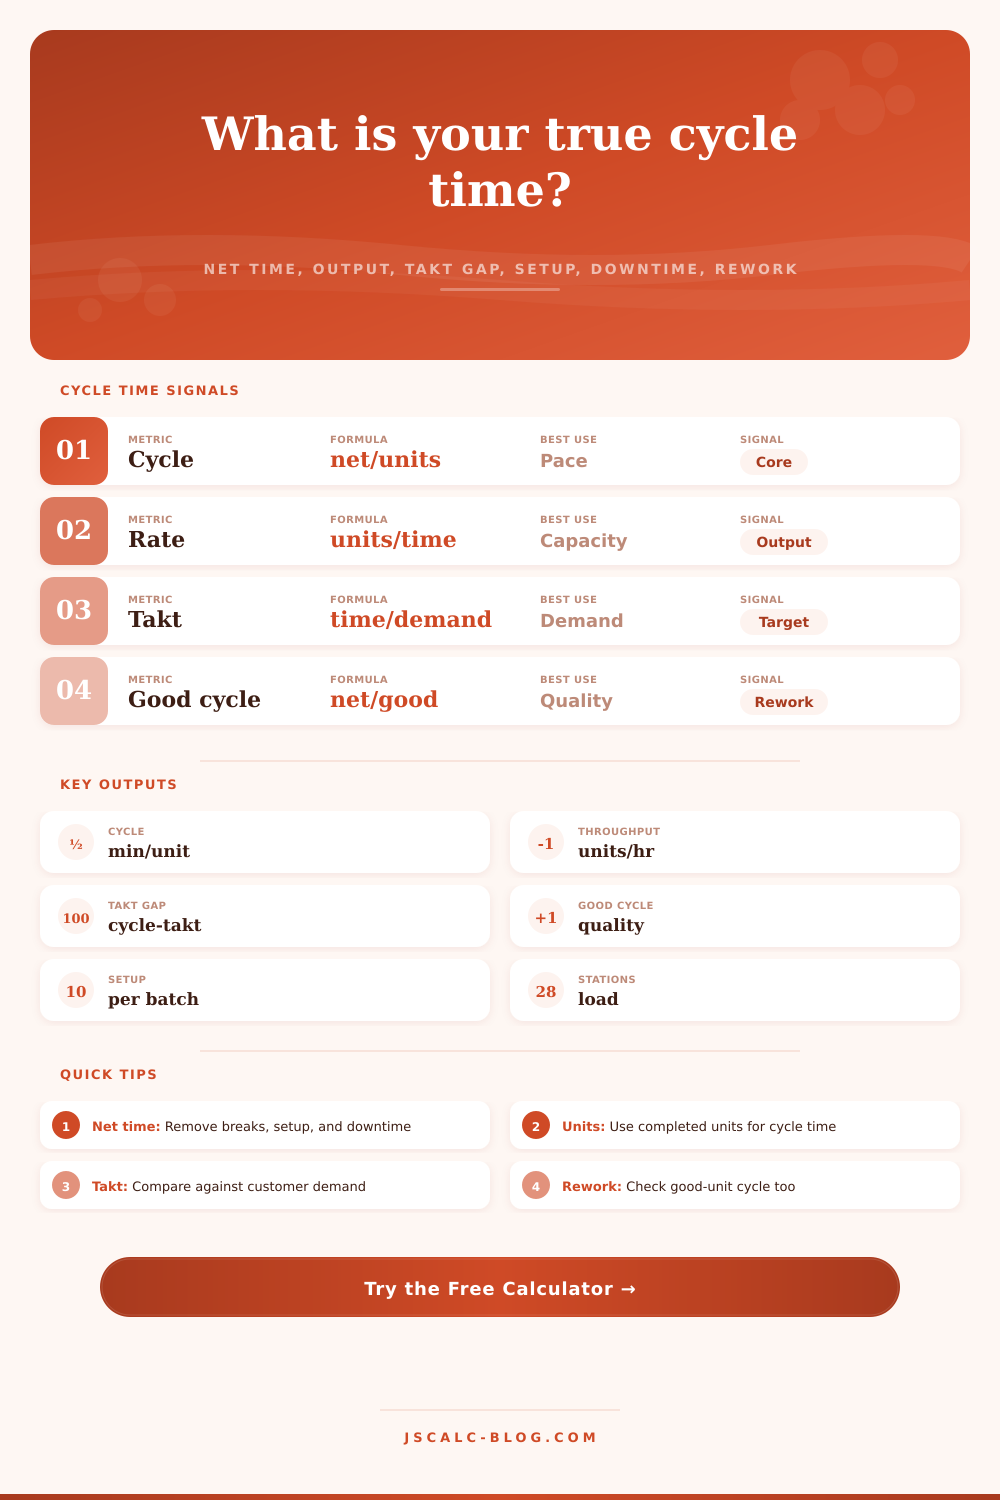
| Cycle time | Cycle time = net production time / units produced | How long one completed unit takes during actual run time | Core formula for this calculator |
| Throughput | Throughput = units / production time | How many units the process makes per minute or hour | The reciprocal of cycle time after unit conversion |
| Takt time | Available customer time / customer demand | The customer-demand pace the process must match | Cycle time above takt means capacity pressure |
| Good-unit cycle | Net production time / good units | How rework or rejects affect usable output pace | Use this when first-pass yield matters |
| All-in cycle | Available time / good units | How breaks, setup, downtime, and quality affect the calendar view | Useful for shift planning and quoted capacity |
| Setup per batch | Setup minutes / batches | How much changeover burden each batch carries | Smaller batches make setup more visible |
| Profile | Typical Watchpoint | Cycle Time Read | Improvement Lever |
|---|---|---|---|
| Manual assembly | Hand work balance and part presentation | Station cycle and takt gap often matter most | Line balance, work instructions, kitting |
| Packaging or bottling | Micro-stops and changeovers | Downtime can hide inside a strong nominal cycle | Centerline settings, SMED, jam reduction |
| Machining batch | Setup allocation and batch size | Pure cut cycle and all-in batch cycle can differ sharply | Fixture design, tool presetting, larger campaigns |
| Molding or stamping | Machine cycle repeatability | Small cycle gains compound across high volumes | Cooling, press settings, mold maintenance |
| Food processing | Sanitation, allergen changeovers, quality holds | Good-unit cycle keeps giveaway and rejects visible | Changeover sequence, checkweighers, hold reduction |
| Warehouse fulfillment | Travel and replenishment delays | Throughput may improve before cycle time feels stable | Slotting, wave size, pick path design |
The speed is known by most production manager, at least how fast the line runs. What they don’t typically know until after the fact is how fast it realy runs. Cycle time seems easy: it’s simply time per unit. That’s a trap in reality. The time between any two part coming off a conveyor might be what you want. However, that doesn’t account for setup, downtime, breaks, or bad units.
The calculator above figure out the math for you and takes out all the noise so you see what is actualy happening in your operation.
Why Real Speed Matters More Than Fast Speed
First: What do we mean by “production time”? Available hours aren’t the same thing as scheduled hours. Let’s say your shift is eight hours including a 45 minute lunch. That means you’ve got only seven and three quarter hour of potentially productive work. Then deduct any unplanned downtime due to jams on machines (which will happen). Deduct set-up time needed between each changeover. Your effective production window gets even smaller.
Most people make these calculations in their head, using gross shift time; that’s why their cycle times appears more favorable then they really are. The tool cleanly breaks this down, and it can calculates the net minutes actually spent producing good stuff. The difference matters, since planning based off gross time results in missing deadlines every single time.
What about quality? Well, okay. Sure. That’s another can of worms. If you make four-hundred units and forty of them require rework, then what good does that do to you? The good-unit cycle takes that into consideration; it’s asking how many good unit it takes to produce one good unit. How much waste effort did you put in on those rejects? That’s the metric that harms your bottom line, not the gross cycle.
Even if your line is running fast but has a lot of rework, your actual capacity isn’t as high as speedometer shows. This is laid out in the reference table on page, which shows you how different types of profiles (e.g., CNC machining vs. Food processing) will deal with those losses differently. For instance, batches is a critical variable in food processing because sanitation changeovers gobble up huge chunks of time.
To keep up with customer demand, you need to aim for takt time. Takt time is calculated by dividing the amount demanded by the available time customers give you. Your actual cycle time can’t exceeds your takt time or you’re not keeping pace with demand. Without any extra shifts or overtime, you’ll never catch up.
On the flipside, if your cycle is shorter than takt time then you’re ahead of schedule but just barely. That means you’ve got some breathing room… as long as your buffer can handle variation. One small jam and you’re in the red. Any cycle time less then a single percent short of takt time is dicey. The difference comes right out of the calculator, a clear signal as to whether you’re on a knife’s edge or have breathing room.
Another wrinkle involves batch size. Smaller batches result in more setups per unit, meaning they spreads the fixed setup costs across fewer units. That puts more of the burden of cycle time on each unit. Run lots of small batches and now the amount of time spent setting up becomes a major portion of both time and cost. The tool shows this trade off, and gives you an idea of how SMED reduces setup time and thereby your actual cycle time.
It also shows station load, which is critical if you are doing manual assembly. One operator may be much slower than another and the entire line will bottleneck due to that slowest station. Getting the line balanced means that fast pace can be sustained in every position.
But once you understand those inputs, everything shifts. It stops being about doing as many parts per hour at any cost. It starts to become about what’s actualy usable and what you can reliably produce. It is a small difference but it is a meaningful one. It helps you prioritize fixing those two things differently, when you know they’re costing money in both time and resources.
You realize cutting down on your rework saves more time than making the machine go faster. That is where smart investments should of been made. Because this isn’t about faster for fast’s sake, it’s about making the process more efficient and predictable. That makes it far easier to see where you need to improve once you’ve got the numbers in front of you. It puts the invisible time back on display. It lets you make plans with confidence instead of hoping.