Complement Probability Calculator
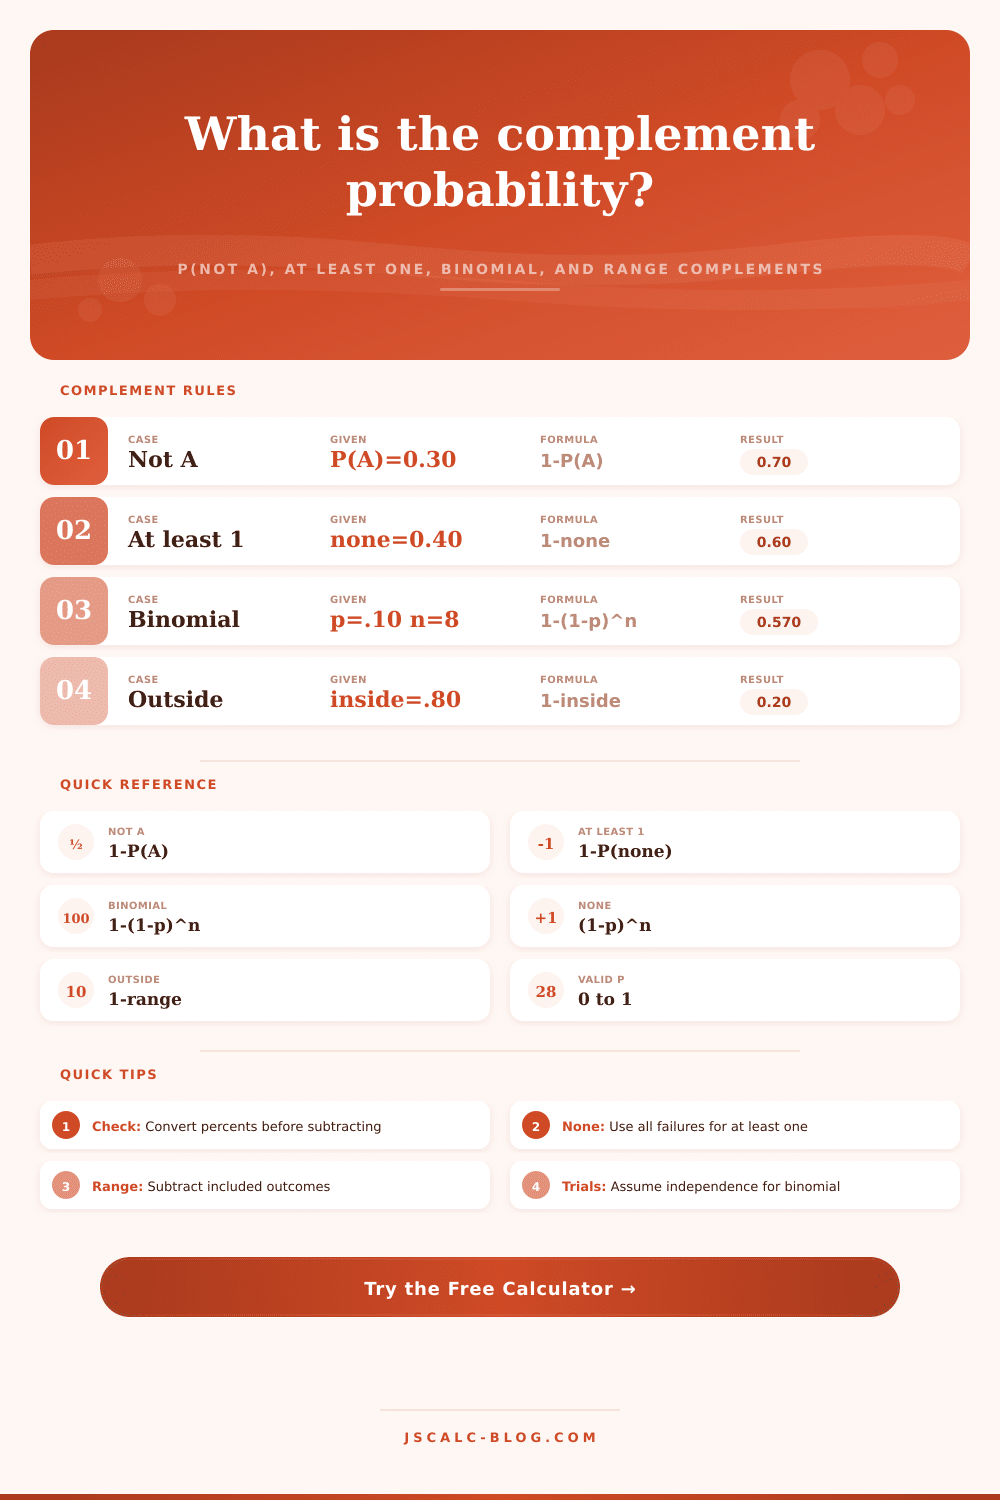
Calculate P(not A), at least one success, binomial complements, and the probability outside a selected outcome range.
| Question | Use When | Formula | Inputs Needed | Common Trap |
|---|---|---|---|---|
| P(not A) | One event probability is known | 1 – P(A) | P(A) | Subtracting a percent before converting |
| At least one | The probability of zero events is known | 1 – P(none) | P(none) | Adding single-trial probabilities together |
| Binomial at least one | Same p is repeated over n trials | 1 – (1 – p)^n | p and n | Using it for dependent trials |
| Outside a count range | You want X below L or above U | 1 – P(L ≤ X ≤ U) | n, p, L, U | Forgetting that endpoints are included |
| Below a range | You want fewer than L successes | P(X < L) | n, p, L | Counting L itself by mistake |
| Above a range | You want more than U successes | P(X > U) | n, p, U | Counting U itself by mistake |
| Input Style | Example Entry | Decimal p | Percent | Complement |
|---|---|---|---|---|
| Percent | 25 | 0.2500 | 25.00% | 75.00% |
| Decimal | 0.125 | 0.1250 | 12.50% | 87.50% |
| Fraction | 1/6 | 0.1667 | 16.67% | 83.33% |
| Odds for | 1:5 | 0.1667 | 16.67% | 83.33% |
| Rare event | 0.5% | 0.0050 | 0.50% | 99.50% |
| Likely event | 80% | 0.8000 | 80.00% | 20.00% |
| Per-Trial p | n = 5 | n = 10 | n = 25 | n = 50 |
|---|---|---|---|---|
| 1% | 4.90% | 9.56% | 22.22% | 39.50% |
| 2% | 9.61% | 18.29% | 39.65% | 63.58% |
| 5% | 22.62% | 40.13% | 72.26% | 92.31% |
| 10% | 40.95% | 65.13% | 92.82% | 99.48% |
| 20% | 67.23% | 89.26% | 99.62% | 99.9986% |
| 50% | 96.88% | 99.90% | 99.999997% | >99.9999% |
| Result Range | Plain Meaning | Decimal Range | Odds View | Check Before Reporting |
|---|---|---|---|---|
| Under 5% | Uncommon complement | 0 to 0.05 | Less than 1 in 20 | Round gently; tiny changes matter |
| 5% to 25% | Possible but not dominant | 0.05 to 0.25 | About 1 in 20 to 1 in 4 | State the original event too |
| 25% to 75% | Middle probability | 0.25 to 0.75 | Neither side is rare | Keep complement wording precise |
| 75% to 95% | Likely complement | 0.75 to 0.95 | More likely than not | Confirm p is per trial, not total |
| Over 95% | Very likely complement | 0.95 to 1.00 | At least 19 in 20 | Avoid saying guaranteed |
| Exactly 0 or 1 | Impossible or certain by model | 0 or 1 | Boundary case | Check for entry or assumption errors |
When the weather report tells you there’s an x percent chance of rain, x is abstract until you translate it into action: you know the difference between what can and will happen. You know how to make the choice between walking in the rain or running for cover.
And it’s not only about the event: it’s about everything else that isn’t the event. Though the headline number grab all the attention, the rest is frequently the biggest portion of any probability problem. When it comes down to it, you focus on the success rate. If a drug work forty percent of the time, you see the forty. You think about the people it helped. You never really think about the sixty percent who didn’t get better. That’s the reality for most people getting the treatment.
The Simple Way to Understand Probability
And that bias make direct probabilities very messy if there are many variations on the success side. It’s hard to add up the odds of throwing exactly one six, or exactly two sixes, or exactly three…or ten times. It’s easy to subtract the odds of throwing no sixes at all from one. The key is knowing what it is you’re measuring.
Now all you have to do is plug in your situation and let the calculator crunch the numbers for you. No need to guess at conversions and coefficients. Everyone speaks a different language of probabilities. Perhaps you’re comfortable expressing your odds as odds. Or perhaps you’re comfortable expressing it as a fraction. Maybe you’re comfortable with percents. The tool understands this and converts everything down to one common format, decimals. Why? Because if you mix formats, you mess up. You can’t subtract a fraction from a percent until you convert one side. Seems obvious, but we do it all the time while rushing and making mistakes. The reference table show how 25% gets converted to.25 before being subtracted.
The only catch is that this rule requires independence. The trials does not affect each other. Pulling one card out of a deck, and not putting it back in, will change the probabilities for your second pull. The complement rule holds true, but the base probability itself has to be calculated different. And if the events aren’t independent, then you can’t rely on the easy binomial shortcut.
Did the pool shrink? Is the environment stable? Those answers dictate whether this is a simple math problem or conditional probability.
The “at least one” problem crops up in numerous places. The possibility that at least one person will click on your advertisement is a marketer’s friend. The possibility that at least one part of a manufactured batch is defective is a manufacturer’s foe. You don’t want to know what happens with just one part; you want to know what happens for all parts together. If there is a 10% chance that each part is bad, then there’s a (90%)^N chance that no part is bad. That N gets very large as the size of the batch grows and the “none” probability drops like a rock. We tend to overestimate the difficulty of rare events becoming probable with enough attempts. One-percent doesn’t sound so good if you do it a thousand times.
Complements add yet another layer: range. In some cases, you don’t even need an exact count. What you’re looking for is whether the number of successes lies outside some range. For example, maybe you’re okay with getting between three to seven heads when flipping a coin ten times. What are the chances of ending up below three or above seven? The tool calculates the middle ground and subtracts it from the whole. That’s good for risk management. You specify what’s within your comfort zone, and then the complement shows you what’s outside. It makes you consider boundaries instead of just averages.
And the result? The value ranges from zero to one. It is always that way. When you get something bigger than one, you screw up. When you get something smaller than zero, you screwed up elsewhere. That’s your safety net. That’s what reminds you that probability measures how often something happens, not how strong it is. Ninety-nine percent doesn’t mean it definitely happens, it means there’s a high chance it does happen. And in a sufficiently big sample, the remaining one percent will show itself. That’s where most folks err. They think that “high probability” equals “inevitable.” It doesn’t. It’s simply a strong expectation.
When you understand the complement, you think about uncertainty different. You begin to realize that it’s not about success but rather about everything else that might happen. You stop seeking out isolated instances and instead begin to examine the system itself. And when you do, you find that failure can be the simple route: it’s the one we’re more likely to model. When you recognize this, the math no longer pushes back against you. The fractions fall into place; the numbers work together; the picture comes into focus.
Instead of wondering whether it’ll rain or not, you ask yourself what it isn’t doing, and all of a sudden, what was once complicated becomes manageble.