Union Probability Calculator
Find P(A∪B), overlap, neither, A-only, B-only, and complement relationships from probabilities or event counts in one sample space.
Use probabilities as percents or decimals; count mode derives every probability from counts.
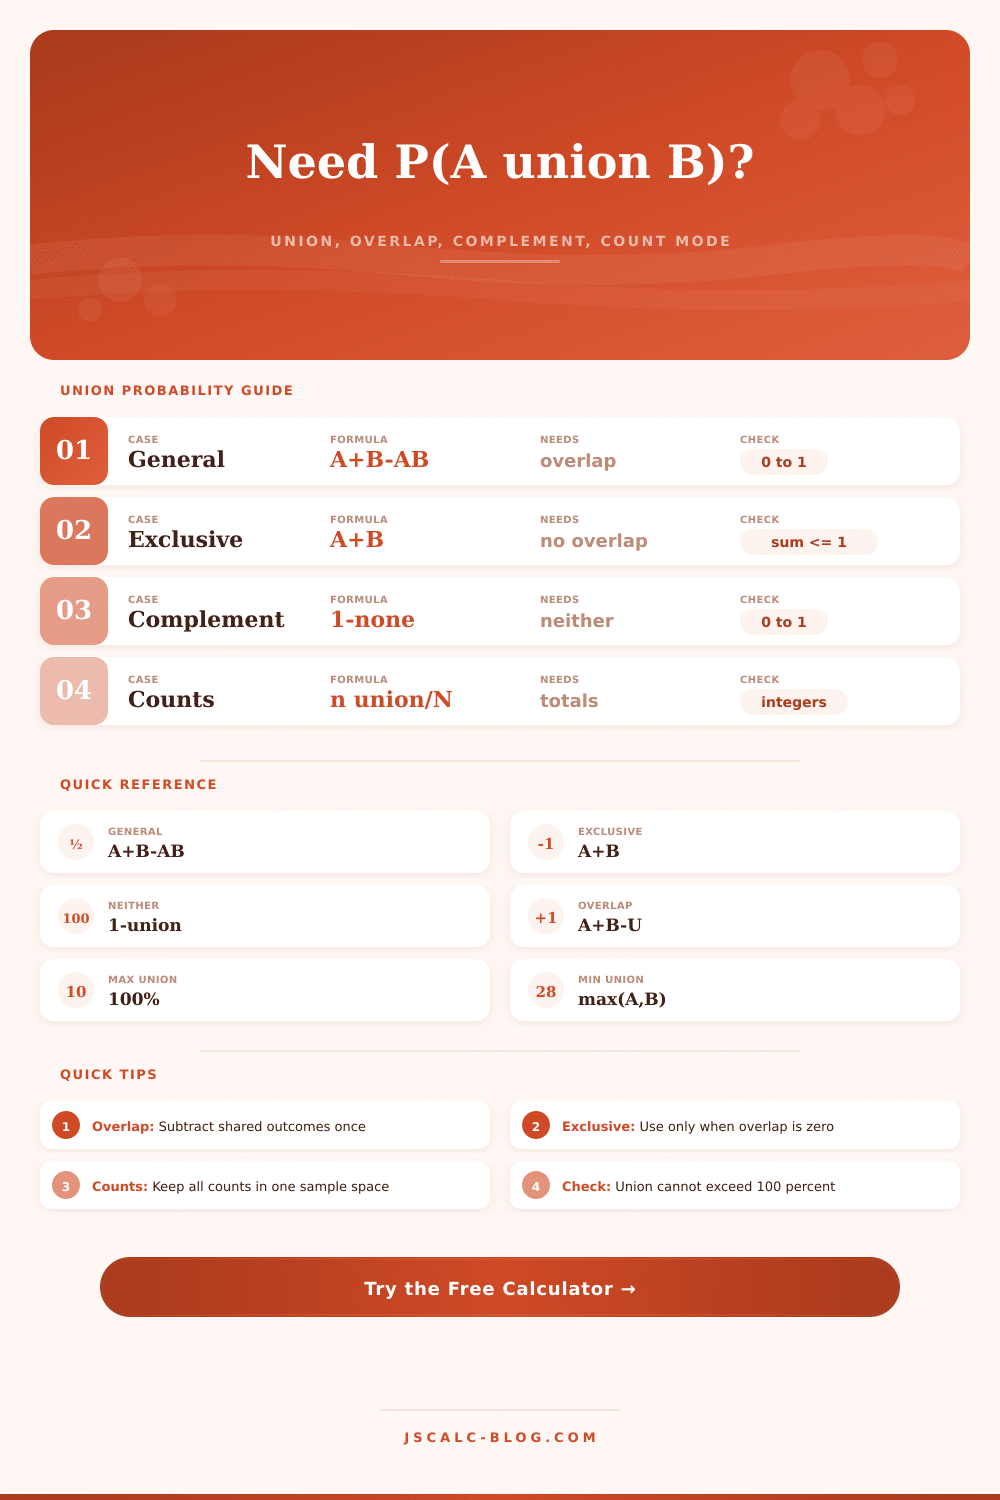
Mutually exclusive events cannot happen together, so P(A∪B) = P(A) + P(B).
Enter 35 for 35%, or 0.35 if decimal mode is selected below.
Probability of event B in the same sample space.
Shared probability counted in both A and B.
Used only when deriving the overlap from a known union.
The denominator for all count-based probabilities.
Observations matching event A.
Observations matching event B.
The overlap count for A∩B.
Used only when deriving overlap from a known union count.
This affects probability mode only. Results always show percent and decimal.
Controls percentage precision in result cards and tables.
| Situation | Formula | Extra input | Main limit | Common use |
|---|---|---|---|---|
| General events | P(A∪B)=P(A)+P(B)-P(A∩B) | Overlap | Overlap cannot exceed smaller event | Survey categories |
| Mutually exclusive | P(A∪B)=P(A)+P(B) | None | Sum cannot exceed 1 | Single roll categories |
| Independent events | P(A∩B)=P(A)P(B) | Independence assumption | Only valid if independent | Separate random processes |
| Known union | P(A∩B)=P(A)+P(B)-P(A∪B) | Union | Union at least max(A,B) | Deriving shared rate |
| Complement route | P(A∪B)=1-P(neither) | Neither | Neither from 0 to 1 | At least one event |
| Input check | Rule | Why it matters | Example pass | Example fail |
|---|---|---|---|---|
| Probability bounds | 0 to 1 | Probabilities cannot be negative or exceed certain | 0.62 | 1.12 |
| Overlap upper bound | At most min(A,B) | Shared outcomes must fit both events | A 0.4, B 0.3, AB 0.2 | A 0.4, B 0.3, AB 0.35 |
| Overlap lower bound | At least A+B-1 | Keeps union below or equal to 1 | A 0.8, B 0.6, AB 0.4 | A 0.8, B 0.6, AB 0.1 |
| Exclusive events | Overlap equals 0 | Events cannot happen together | Red card or black card | Heart or face card |
| Count mode | Counts share total | All rates must use same denominator | 120 of 500 | 120 of one group, 500 of another |
| Sample space | Event A | Event B | Overlap | Union |
|---|---|---|---|---|
| 52-card deck | Hearts 13 | Face cards 12 | Heart face 3 | 22 of 52 |
| Six-sided die | Even 3 | At least 5 is 2 | Only 6 is 1 | 4 of 6 |
| Survey 1000 | Stream 430 | Game 360 | Both 210 | 580 of 1000 |
| Defects 500 | Scratch 46 | Dent 31 | Both 8 | 69 of 500 |
| Clinic 240 | Fever 84 | Cough 96 | Both 42 | 138 of 240 |
| Email 20000 | Open 6400 | Click 1700 | Clickers 1550 | 6550 of 20000 |
| Reported value | Meaning | Formula | Use in writing | Range |
|---|---|---|---|---|
| P(A only) | A happens without B | P(A)-P(A∩B) | Unique to A | 0 to 1 |
| P(B only) | B happens without A | P(B)-P(A∩B) | Unique to B | 0 to 1 |
| P(both) | A and B together | P(A∩B) | Overlap | 0 to min |
| P(neither) | Not A and not B | 1-P(A∪B) | Complement | 0 to 1 |
| P(at least one) | A, B, or both | P(A∪B) | Union | max to 1 |
JSCalc-Blog.com: This union probability calculator uses P(A∪B)=P(A)+P(B)-P(A∩B), P(A)+P(B) for mutually exclusive events, the complement relation, and count mode from raw outcomes.
For instance: What are the chances that a randomly pulled card is a face card or a heart? Your gut reaction might be to simply sum their individual chances, but as we’ve seen our guts is frequently incorrect. In counting the cards mentally, we include each outcome exactly once, except that we double-count Jack of Hearts. That means we perceive greater likelihood than actualy exists. That’s the union problem.
The calculator (above) does all the math for you, subtracting out intersection automatically. Given the base probabilities and their shared overlap, it spits back actual probability of either one happening. That’s because it’s OK to add up probabilities as long as the events is mutually exclusive, in other words, if they aren’t mutually exclusive, you have to account for the overlap.
Why You Should Not Add Probabilities Directly
For example, if you’re rolling a die and asking what the likelihood is of seeing either a one or a two, those are mutually exclusive event and you can safely add up their respective odds (since neither can occur simultaneously). Unfortunately, reality isn’t that clean. A respondent to your survey might use video games while streaming movies. Your product could get dented and scratched during manufacture. And those overlapping possibilities can make it hard to accurately estimate the probability. You have to consider where these possibilities overlap or else you will overestimate the risk.
This is why shared probability is important. It’s that common ground between the two events. Double counting them without taking that into account makes no sense. That’s what the general formula does to fix the sum, it subtracts that overlap once. Think of it like Venn diagrams. If you have two overlapping circles, you don’t want to add the areas of both circles together; you just want total area covered by them.
So the tool splits things into separate sections: here is how much is A alone, here is how much is B alone, and here is how much is A and B together. That level of detail can help you see exactly where you’re at risk. This often happens with medical studies and other types of business analytics when you don’t have that overlap data upfront. In this case, you know the number of people who got the email, then the number who opened it, then the number who clicked on it. With those, you can work backwards.
Using the calculator, you can enter what’s already known: the union. And it will calculate for you the overlap. From there, it calculates missing puzzle piece. That could of been useful if you’re looking at a particular group’s behavior or trying to audit some data quality.
Or there’s the complement approach, which is usually more intuitive. Rather than compute how likely something is to occur, compute how likely it is not to. For example, if you are trying to figure out the likelihood that at least one server fails in a given datacenter, it can be easier to determine the likelihood that all servers operates perfectly, then subtract that number from one. This logic exists in the tool as well and provides another view of the same reality.
Probability is a matter of boundaries. There’s always 100 percent (or one), and everything else are carving up that certainty. Another handy thing about it is that it allows you to use raw counts rather than percentages. In real life, we don’t often get data with nice round percentages; we get raw numbers. Five hundred customers bought apples, three hundred bought bananas, and one hundred bought both. By dividing by the total population (the denominator), the calculator transforms those integers into probabilities. That way, when you compare rates, they’re on equal footing.
A fatal mistake is to mix denominators, to compare a rate calculated based off a sample size of ten to a rate calculated based off a sample size of ten-thousand, unless you make them the same beforehand. The tool makes sure this doesn’t happen.
But first: does your input actualy make sense? Does it pass logical tests? Can the overlap between the two events exceed the smaller event itself? Of course it can! Wait, actually, it must. More people can’t do both A and B than just A. More people can’t do both A and B than just A. Of course not! More people can’t do both A and B than just A. And the calculator knows this. When your numbers break this simple rule, it will tell you so and prevent you from drawing any conclusions based on impossible data. That’s why it’s a safety net for human error.
Ultimately, probability isn’t that complicated. It’s not a matter of fiddling with formulas; it’s a matter of thinking clearly. That means understanding the nature of the events involved and how they relate to each other. Whether you’re playing cards, predicting user behavior, or calculating financial risk, the rules is the same: you check the bounds, you account for overlap, and then you let the math do the heavy lifting. The point is not guessing but measurement. And when you get rid of the double-counting of overlap, things starts to make sense.