Joint Probability Calculator
Calculate P(A∩B) for independent events, dependent events, observed intersections, and multi-event product chains, with union, complement, odds, and formula checks shown together.
🎯Joint Probability Presets
📝Joint Probability Inputs
Use 0.50 for 50 percent.
Used for independent mode and union comparison.
Chance of B after A is known to happen.
Observed cases where A and B both happen.
All observations or equally likely outcomes.
Enter 2 to 8 decimals separated by commas, spaces, or line breaks. The calculator multiplies them as p1 x p2 x ... x pn.
🔢Core Symbols
📐Joint Probability Formula Table
| Situation | Formula | Inputs Needed | Meaning |
|---|---|---|---|
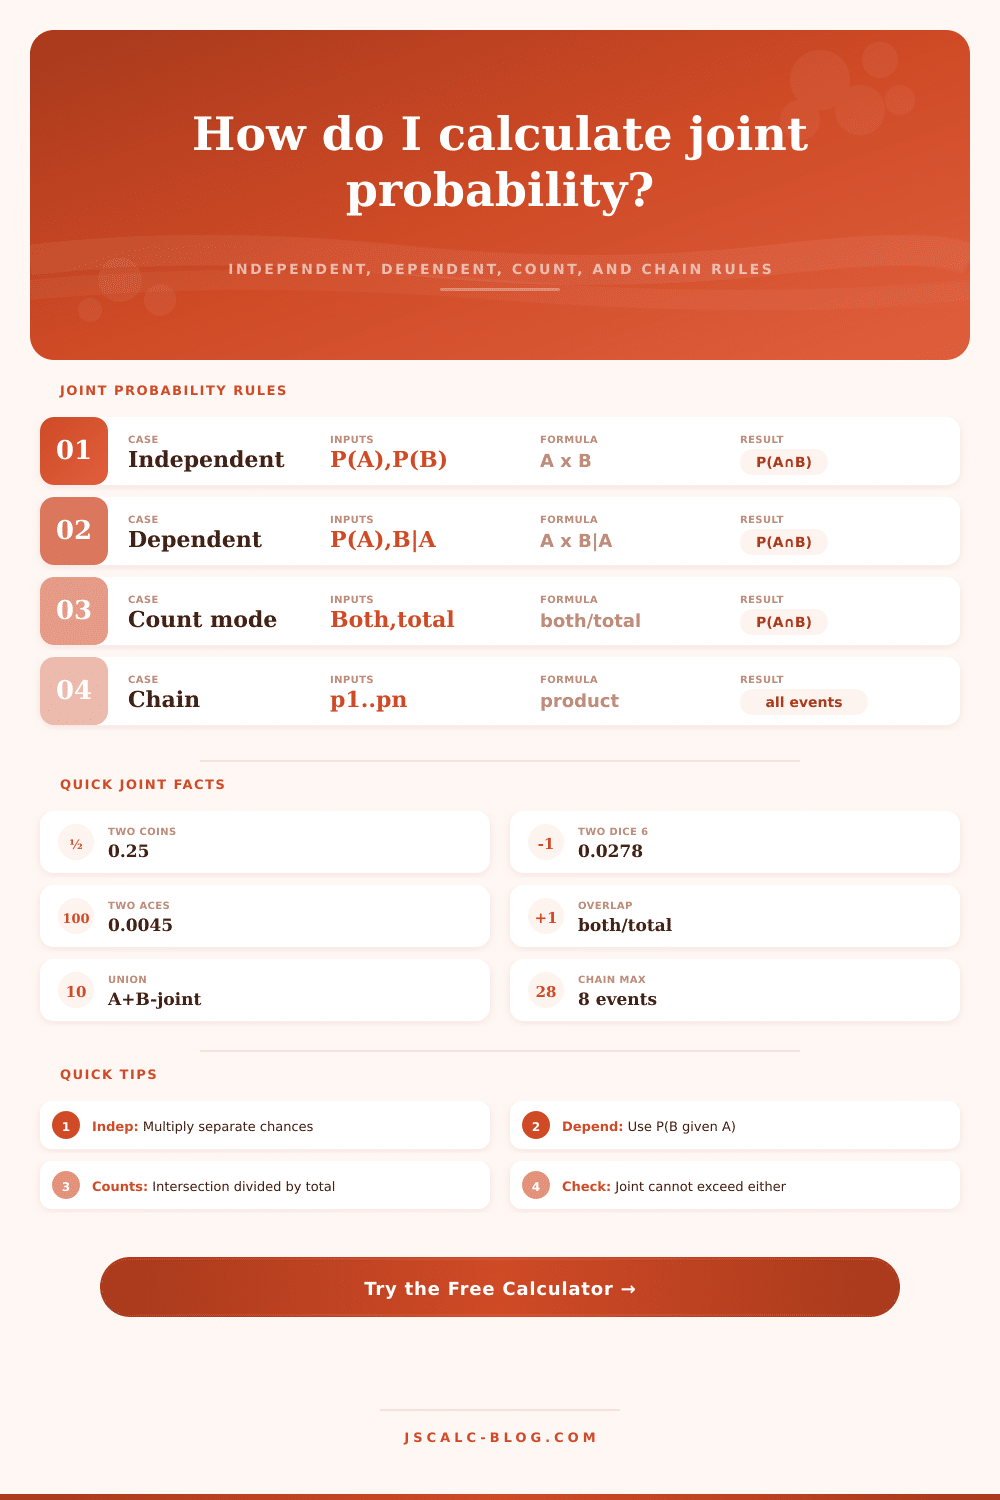
| Independent events | P(A∩B) = P(A) × P(B) | P(A), P(B) | A does not change B. |
| Dependent events | P(A∩B) = P(A) × P(B|A) | P(A), P(B|A) | B is conditional on A. |
| Count mode | P(A∩B) = both / total | Intersection, total | Use observed overlap. |
| Multi-event chain | P(all) = p1 × p2 × ... × pn | Each event probability | All listed events happen. |
| Inclusive union | P(A∪B) = P(A) + P(B) – P(A∩B) | P(A), P(B), joint | At least one happens. |
| Not both | 1 – P(A∩B) | Joint probability | Everything outside overlap. |
⚖Mode Comparison Grid
| Mode | Best For | Example | Main Check | Common Mistake |
|---|---|---|---|---|
| Independent | Coin flips, unrelated sensors, separate dice | 0.5 × 0.5 = 0.25 | Events do not influence each other | Using this for no-replacement draws |
| Dependent | Card draws, conditional risk, staged funnels | 4/52 × 3/51 = 0.0045 | P(B|A) is after A happens | Multiplying by original P(B) |
| Count | Survey overlap, records, contingency data | 86 / 500 = 0.1720 | Intersection count is within total | Dividing by only group A or B |
| Chain | All steps must succeed in sequence | 0.8 × 0.75 × 0.9 = 0.54 | Every p is in 0 to 1 | Adding probabilities instead |
📊Quick Scenario Table
| Scenario | Calculation | Joint Probability | Percent | Odds |
|---|---|---|---|---|
| Two heads in two coin flips | 0.5 × 0.5 | 0.2500 | 25.00% | 1 in 4 |
| Two dice both show six | 1/6 × 1/6 | 0.0278 | 2.78% | 1 in 36 |
| Two aces without replacement | 4/52 × 3/51 | 0.0045 | 0.45% | 1 in 221 |
| Rain and traffic delay | 0.30 × 0.60 | 0.1800 | 18.00% | 1 in 5.56 |
| Disease and positive test | 0.02 × 0.90 | 0.0180 | 1.80% | 1 in 55.56 |
| Three made free throws | 0.80 × 0.80 × 0.80 | 0.5120 | 51.20% | 1 in 1.95 |
| Observed survey overlap | 86 / 500 | 0.1720 | 17.20% | 1 in 5.81 |
| Four-part system succeeds | 0.99 × 0.98 × 0.97 × 0.96 | 0.9035 | 90.35% | 1 in 1.11 |
🔗Joint, Union, and Complement Table
| P(A) | P(B) | Independent Joint | Union | Not Both |
|---|---|---|---|---|
| 0.10 | 0.20 | 0.0200 | 0.2800 | 0.9800 |
| 0.25 | 0.25 | 0.0625 | 0.4375 | 0.9375 |
| 0.30 | 0.60 | 0.1800 | 0.7200 | 0.8200 |
| 0.50 | 0.50 | 0.2500 | 0.7500 | 0.7500 |
| 0.70 | 0.80 | 0.5600 | 0.9400 | 0.4400 |
| 0.90 | 0.90 | 0.8100 | 0.9900 | 0.1900 |
⚙Full Formula Breakdown
💡Practical Joint Probability Tips
The answer hangs on whether or not two thing occur at the same time, as though standing on the edge of a choice. Perhaps a medical test comes back positive while your symptoms emerges, too, you’re not just wondering if one thing happens, but if both happen together? That’s the whole world of joint probability. It is rarely about whether one thing occur. Instead, it is about where several things meets.
Most people naturaly assume there is a line from A to B, but life tends to be messy and forces us to look at these meeting points instead. The key is knowing what it is we’re trying to predict as an overlap.
What Is Joint Probability?
Once you plug in your rates, the calculator (above) does the math for you, but without you having to do the guesswork of converting coefficients and whatnot. But you still need to know whether to use the “independent” or “dependent” mode.
For independent events, where you’re really flipping two different coin, you just multiply their probabilities. The fact that one comes out heads doesn’t somehow change the other coin’s magic fate, so it’s a nice clean multiplication. But most thing in life aren’t quite so clean.
In reality, most events is dependent; when you pull a card from the deck, it alters the odds of what the next card you pull will be. The deck got smaller and its composition change. And this is why people mess up: They treat dependent events as though they was independent, leading them to come up with probabilities that are WAY more high.
So the tool allows you to toggle between these modes so that you can choose the correct way to view the situation. Count mode is also usually the best way to proceed when you actualy have some data. Rather than guess at the chance of one thing happening given another, go straight for overlapping number itself.
If your survey got five-hundred responses and eighty-six selected any two particular boxes, then their joint probability equals that overlap as a fraction of the total. No need to know why those respondents had ticked both boxes; just that they did. No need to sort through noise of theoretical assumptions; just point to the observed reality. That’s robust. You don’t build on the sand; you use observed counts. A small thing, yes, but it matters so stop.
Then there’s chains. If an end goal needs several step to achieve, then the likelihood of completing the entire chain is found by multiplying the probability of each step. Every link take away from the total just a bit. Even if all your components have a 90% success rate, a system with four components doesn’t have 36%, it has roughly 90%, and that sounds great until you remember that a single failure will kill the entire endeavor. The calculator multiplies them together so that you can visualize how reliability decay with every additional requirement. It will show you, precisely, how fragile long chains is.
The complement is a sanity check that gives the probability that neither occurs. Union give you the probability that at least one will occur. If you find that your union is less than the sum of its parts, you probably have a large enough joint probability that you need to account for the overlap. This prevents you from double counting which means you’ve done something right with your input. You can also check that your input makes sense based off the logical relationship between these three probabilities. The probability of the two events jointly occurring should never exceed the probability that either event occur alone, so if it does, your model has some problem.
Joint probability comes down to this: that nothing happens in isolation. If you’re trying to plan a project, calculate your risks, or even just wonder about the odds of something happening, you need to know when and how those things overlap. This provides a better understanding of what’s going on. It makes you acknowledge that there are dependencies hiding in plain sight. Next time you find yourself with a decision between two variable, seek out their overlap (it’s where the truth tends to live).