Independent Event Probability Calculator
Calculate independent intersections, unions, all-events probability, no-event probability, at-least-one probability, and exact-one probability from two events, repeated trials, or a custom event list.
The mode changes how the displayed formula is interpreted.
Use one format consistently across probability fields.
For repeated mode, this is the single-event success probability.
Used in two-event and custom-list modes.
Set to 0 when your list has fewer than three events.
Custom-list mode ignores blank or zero optional entries.
Use this for a fifth independent event in a chain.
Used only for n identical independent events.
| Question | Formula | Independence Meaning | Inputs Needed | Typical Use |
|---|---|---|---|---|
| Both A and B | P(A∩B)=P(A)P(B) | Knowing A does not change B | P(A), P(B) | Two separate random processes |
| A or B | P(A∪B)=P(A)+P(B)-P(A)P(B) | Overlap equals product | P(A), P(B) | Either event can happen |
| All n identical | P(all)=pn | Same p on each trial | p, n | Repeated success chain |
| None identical | P(none)=(1-p)n | Every trial independently fails | p, n | Zero-success probability |
| At least one | 1 - product of failures | Use the easier complement | Every event probability | Any alert, sale, defect, or hit |
| Exactly one | Sum of one-success terms | One p happens while all others fail | Every event probability | Single winner or single trigger |
| Preset | Mode | Probabilities | Main Question | Independence Check |
|---|---|---|---|---|
| Coin and Die | Two events | 1/2 and 1/6 | Heads and six | Separate devices |
| Two Sensors Trigger | Two events | 92% and 88% | Both detect | Independent sensor paths |
| Email and Webinar | Two events | 32% and 18% | Open or attend | Use only as a model assumption |
| Five Station Pass | Custom list | 98%, 97%, 99%, 96%, 95% | All stations pass | Station outcomes isolated |
| Server Uptime Chain | Custom list | 99.9%, 99.5%, 99.2%, 98.8% | All services up | No shared outage driver |
| At Least One Six | Identical n | 1/6 across 10 rolls | Any six | Fair independent rolls |
| Single Event p | n = 2 All | n = 5 All | n = 5 At Least One | n = 10 At Least One |
|---|---|---|---|---|
| 1% | 0.01% | 0.00000001% | 4.90% | 9.56% |
| 5% | 0.25% | 0.000031% | 22.62% | 40.13% |
| 10% | 1.00% | 0.0010% | 40.95% | 65.13% |
| 25% | 6.25% | 0.0977% | 76.27% | 94.37% |
| 50% | 25.00% | 3.125% | 96.875% | 99.902% |
| 80% | 64.00% | 32.768% | 99.968% | 99.99999% |
| Diagnostic | What To Check | Good Example | Risky Example | Calculator Impact |
|---|---|---|---|---|
| Common cause | Do outcomes share one driver? | Separate coin and die | Two services on one power circuit | Product rule may overstate certainty |
| Replacement | Does probability reset? | Rolls of a die | Cards drawn without replacement | Later event p may change |
| Time window | Are events in the same period? | Daily alert rates together | Daily p mixed with monthly p | At least one can be distorted |
| Same denominator | Do probabilities refer to one population? | Users in same campaign | Visitors plus all accounts | Union wording becomes muddy |
| Mutual exclusion | Can both happen at once? | Open and click can both happen | One die showing 2 and 5 | Independent formula is not appropriate |
| Rounding | Are tiny probabilities rounded? | 0.003 as entered | 0.00 after rounding | Products can disappear visually |
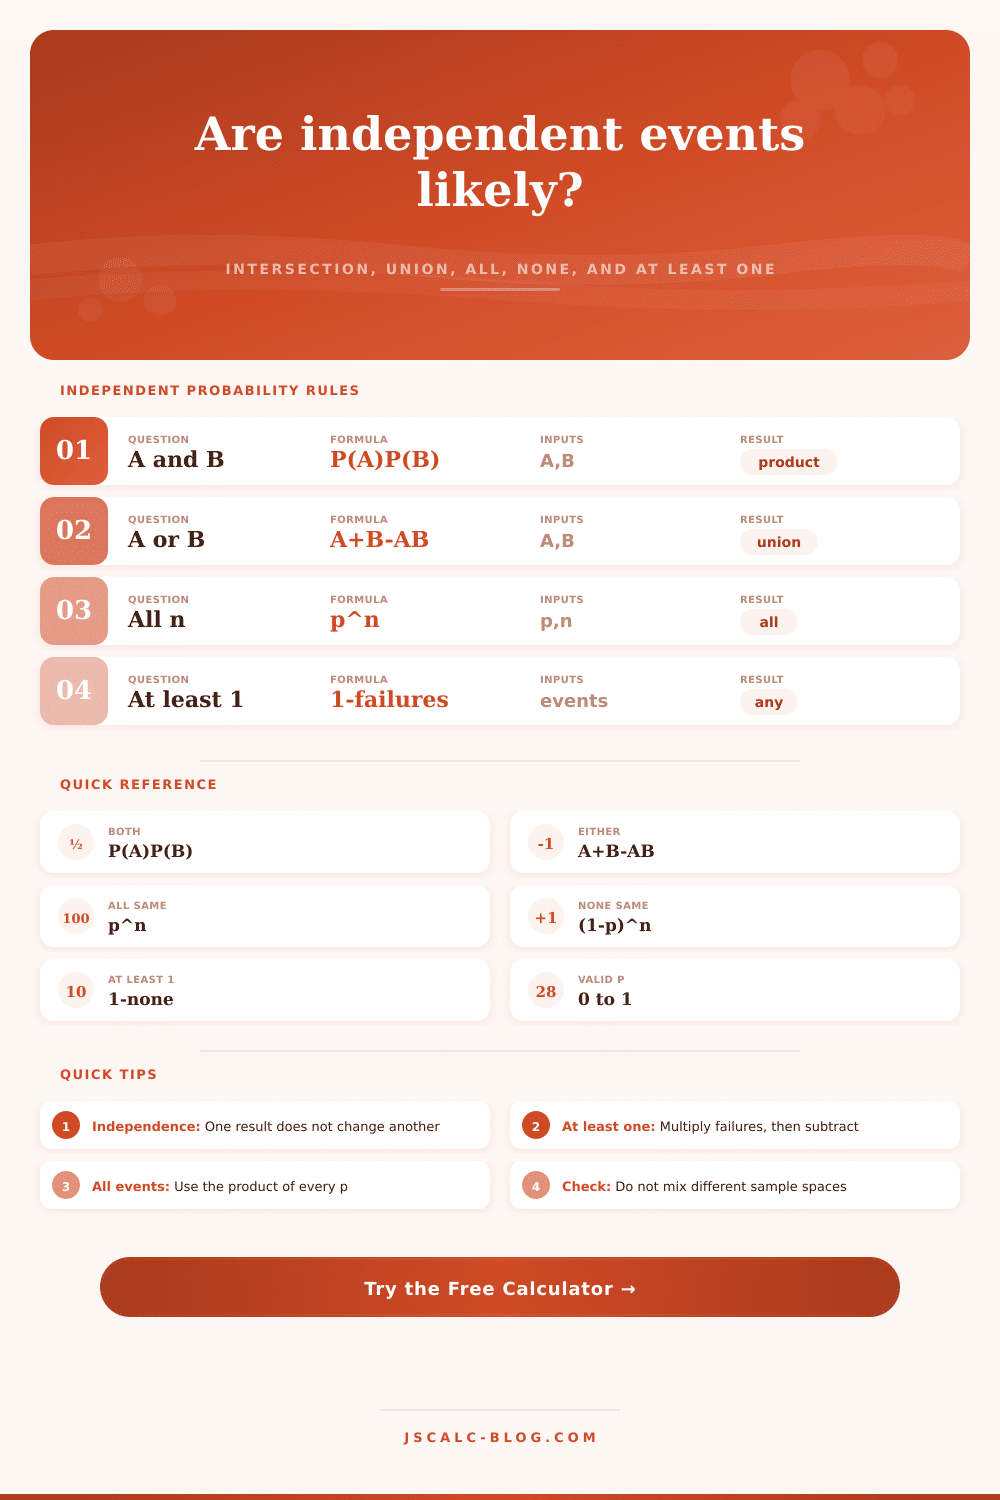
JSCalc-Blog.com: This independent event probability calculator uses P(A∩B)=P(A)P(B), P(A∪B)=P(A)+P(B)-P(A)P(B), product rules for n independent events, and at least one = 1 minus the product of failures.
How likely is it that I’ll land on my target? What about landing on my target multiple times in a row?
If events are independent, just multiply the probability. By definition, one event cannot impact other. When they’re connected, however, the mathematics become more complicated. That’s where this tool comes into play.
How to Use the Probability Calculator
This thing recognize the difference between a simple intersection and a complicated chain of events.
A probability model has one key assumption. Events is independent. In other words, one event does not tell you anything about the next. There’s no memory of last head on your coin flip. Because there’s no memory, you can multiply the probabilities out neatly.
When events are connected, the math fall apart. Drawing cards without replacement. The calculator will assume this break the link for you. Check it yourself.
So: do you wish something or anything? They’re different scenarios.
In an all events situation the odds diminish, because control must be passed at every station in the chain. Each additional step reduce the outcome rapidly. That’s why complex systems is fragile. You can see that loss drop in the all-events mode of the calculator.
In general adding elements add potential failures. And generally speaking, the higher number of events, the greater likelihood that at least one of them will trigger. That’s why we use backup systems: because if you’ve got three server, it’s unlikely that all three are going to fail.
One minus the probability that everything fails equals the probability that at least one succeed. And the tool calculates this complement for you. You don’t have to do a long chain of additions and subtractions yourself. It makes a hard problem look like lookup table.
The trouble for many is understanding that there’s only one thing that can happen. There is only one little sliver of probability. There is one success, but all others must fail. Multiple scenarios gets summed together. Each event in turn get to be the winner. The calculator pulls out just the terms for you. It avoids any scenario where two things are happening. The gap between exactly one versus at least one can be huge.
That’s where the reference table on the page comes into play. Before you even type, this will help you select the right formula for your needs.
How do you mix things up? Don’t mix percent and decimal fraction values. Don’t mix units. These will result in nonsensical outcomes. Fortunately, the tool does let you toggle between formats, but stick with a single format. This small discipline prevent most common errors in manual calculation.
Dependencies are often hidden in real world scenarios. Initially two sensors appear independent. However, they may be powered by the same source. One voltage drop could mute them both. The calculator doesn’t see that common circuit. To get it right, you need to supply that context to the equation. You must make sure the inputs represents true independence. When you do, the output provides a trustworthy guide. It lets you know if a strategy has a statistical leg to stand on.
Good planning means measuring risk. That’s what probability does. Probability measures unknowns by a set of known rules. It doesn’t predict what happens next; it tells you what might happen, how likely each outcome is. Whether checking system uptime, or plotting a campaign, the math stay the same: you describe the possible outcomes, confirm they’re independent of one another, and let the equation crunch the numbers. The math is done for you. You provide the framework. Together, that’s a calculated risk, instead of guessing.
It would of been better to plan ahead.