Mutually Exclusive Probability Calculator
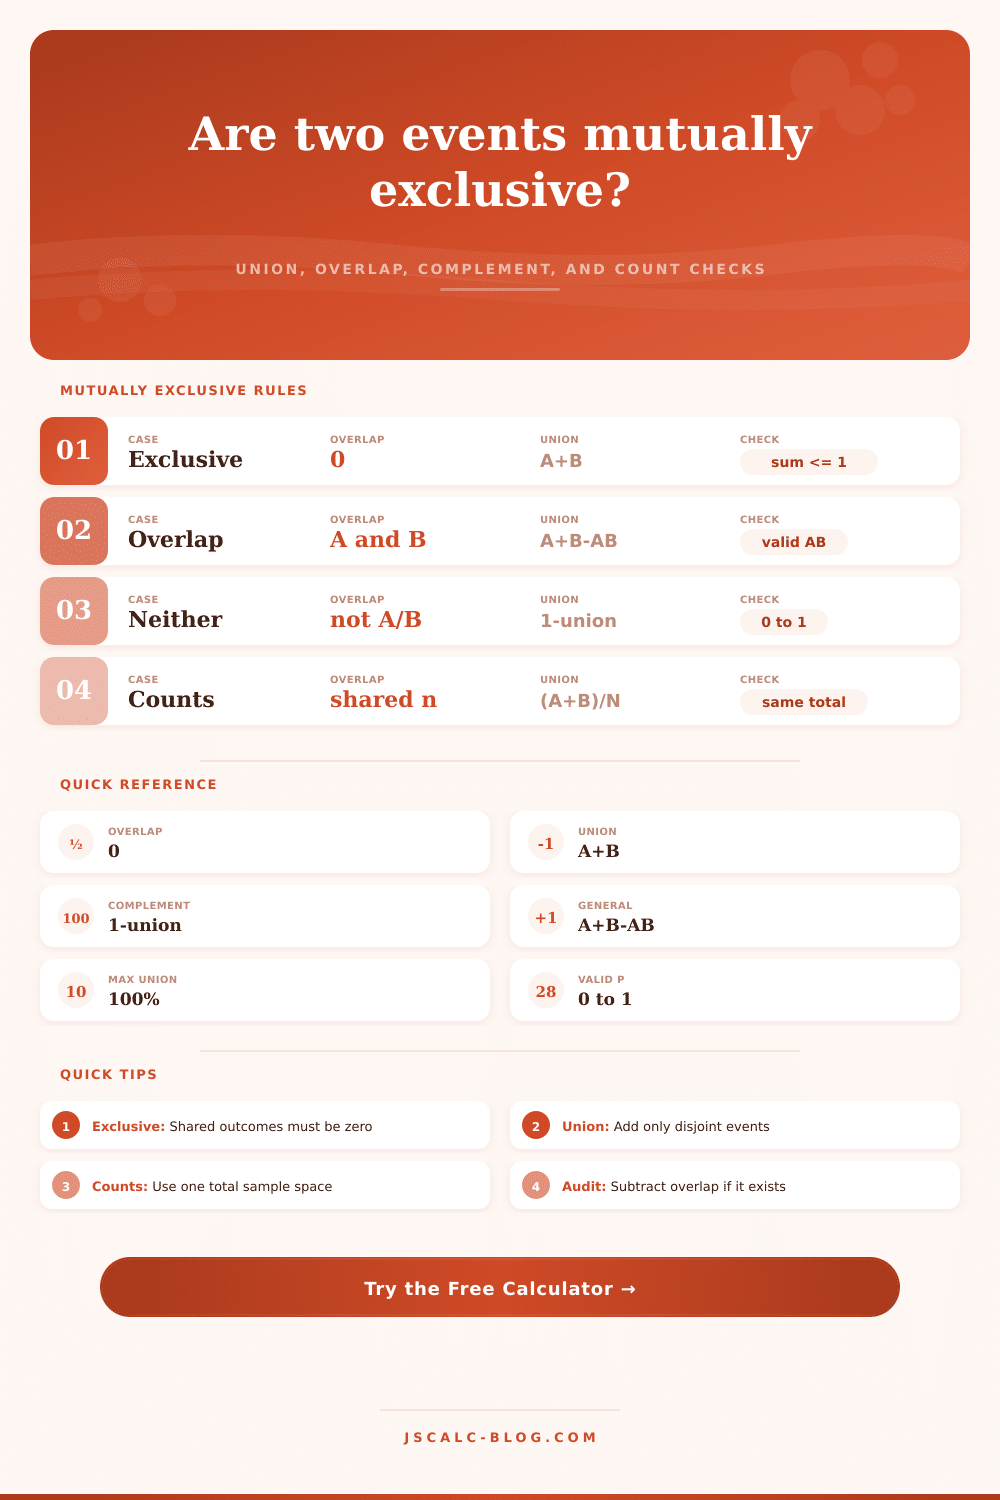
Add disjoint event probabilities, verify that overlap is zero, find the complement, and compare against the general union formula.
Enter 30 for 30%.
Enter 20 for 20%.
Use 0 for mutually exclusive events.
Enter probabilities and calculate. For mutually exclusive events, P(A∩B) must equal 0.
| Situation | Can A and B occur together? | Union formula | Calculator check | Common example |
|---|---|---|---|---|
| Single roll category | No | P(A∪B)=P(A)+P(B) | Overlap must be 0 | Roll a 1 or roll a 6 |
| Single-choice survey | No, if one answer only | P(A∪B)=P(A)+P(B) | Sum cannot exceed 1 | Primary commute is bus or bike |
| Two marketing channels | Yes | P(A∪B)=P(A)+P(B)-P(A∩B) | Subtract shared audience | Email clicker and ad clicker |
| Defect tags | Often yes | P(A∪B)=P(A)+P(B)-P(A∩B) | Overlap cannot exceed smaller event | Paint flaw and loose fastener |
| Clinical disposition | No, for final path | P(A∪B)=P(A)+P(B) | Categories must be final and distinct | Discharge or observation |
| Outside both events | Not applicable | P(neither)=1-P(A∪B) | Complement must stay between 0 and 1 | Not red and not blue |
| Input | Probability form | Exclusive rule | General comparison |
|---|---|---|---|
| Event A count | A count / total | Added to B | Added to B then shared count is removed |
| Event B count | B count / total | Added to A | Overlap cannot be larger than A or B |
| Shared count | Shared / total | Must be zero | Subtracted once from A + B |
| Neither count | Total - union count | Total - A - B | Total - A - B + shared |
| Feasible overlap | Between lower and upper bound | Exactly zero | max(0,A+B-1) to min(A,B) |
There are four kings in a standard deck of cards, so probability of pulling one out is four in fifty-two. There are four queens in the deck, so the probability of pulling one is four in fifty-two. Adding these two probabilities together is simple and make sense.
But what if instead of just one draw you’re studying a survey of people’s favorite snack? Thirty percent of people say they love cookies, while another thirty percent say they love chips. Sixty percent! You add them together. That’s wronger. Because some people like both. They has double counted, which is why most people trip on this. It’s about whether the events can occur simultaneously.
How to Calculate Probability Correctly
What’s a disjoint set? By definition, a disjoint set are mutually exclusive, meaning that one can’t happen while another does. For example, when you flip a coin, it can be tails or it can be heads. But it cannot be both. It’s a simple mathematical formula that involves nothing but addition in that scenario. Add the probability of event A to the probability of event B, and then you have your overall probability.
When you’re working with numbers (either as raw counts or as percentages), this calculator will do the math for you right away. It spares you from any chance of human error on your end. Just make certain that two sets of data you input are truly separate categories prior to pressing “calculate.
Where it gets dicey is understanding where exclusivity falls apart. For example, say you market via email, and then via social media, and then many people click both, which happens all the time in marketing. If you treat each group separately and add up probabilities, you will double-count some people. This makes it look like you have more unique views on your campaign than you actualy do.
Switching modes lets you test whether using a more inclusive “union” formula work better by comparing that to an exclusive assumption. That’s helpful to understand the price tag for not accounting for overlap, since you’re forced to knock off the part they had in common from top-line.
How about a factory floor? A widget may have both a dent and a scratch. But if you tally up only dents or just scratches, then you’re overlooking widgets with two type of defects. The page’s reference table explain how to manage such overlapping categories. In short: You subtract the joint probability to adjust the overall calculation in a way that keeps it accurate. That is, you aren’t double-counting one defective product. That would skew your estimate of yield as well as your repair bills.
Occasionally the information will be presented as counts (as opposed to percentages). For example: out of one hundred items, thirty had defect A; twenty had defect B; but five had both A and B. To convert those to probabilities, it’s just a matter of dividing by the total, but reasoning is identical. Don’t forget about the five that had both. This is where accounting for overlap gets important.
Fortunately, the tool handles inputting as counts, making it easier if your source data is something like an inventory log, or raw survey responses. Just provide the total number of each type and the tool will do all the decimal/fraction converting for you. No more math on-the-fly.
“Two things can’t happen at once”, This is another common error where people confuse “low probability” with “exclusive.” Two unlikely outcomes don’t have to be exclusive; just look at winning the lottery and being struck by lightning. They’re individually improbable, but also not unable to happen at the same time (theoretically, even though the likelihood of them occurring simultaneously is close to zero).
In any case, always read the fine print: What’s the definition of these two events? Is it possible for one event to fulfill both criteria? If so, use the subtraction method. If not, simple addition will do.
A second helpful metric is the compliment. That’s the probability that both events will not happen. This is frequently more important then the actual combination. What is your risk of remaining safe? In risk management, you want to know this. The calculator spits this number out for you as well. It simply takes 1 minus the union. So it shows you what remains. A handy measure of exposure.
That understanding shifts the perspective on information. It transforms mere addition into thinking about how things overlap. “What are these things?” becomes your question as you begin considering category boundaries. How are they related? Are they mutually exclusive? Those questions show something deeper about the system than the numbers themselves. Correctly framing the problem is where the juice lives.
That’s why the tool is merely a helper. Know what you’re measuring before you measure it. So first define your events clearly. Next check for overlap. Select the proper formula. After that, let the tool take over. You don’t inflate your numbers or have false confidence in those inflated numbers. Instead you see a clearer picture of the odds. And that clarity is worth the extra thought.