F1 Score Calculator
Enter true positives, false positives, false negatives, and true negatives to calculate precision, recall, F1 score, F-beta score, accuracy, support, and confusion-matrix diagnostics for a classifier, detection system, audit queue, or screening model.
🎯Classifier Presets
📝Confusion Matrix Inputs
The label appears in the breakdown and helps interpret the error tradeoff.
Optional model cutoff used to produce this exact TP, FP, FN, TN table.
Predicted positive and actually positive.
Predicted positive but actually negative.
Predicted negative but actually positive.
Predicted negative and actually negative. F1 does not use TN, but accuracy and specificity do.
Beta above 1 weights recall; beta below 1 weights precision.
Used only when custom beta is selected; output precision is controlled by the table below.
Applies to percentages, ratios, and score outputs.
🧮Live Metric Grid
📊Current Confusion Matrix
📋Metric Formula Table
🔎F Score Interpretation Bands
| Score Band | Typical Read | What It Usually Means | Check Next |
|---|---|---|---|
| 0.00 to 0.40 | Weak | Precision, recall, or both are low for the positive class | Inspect labeling and threshold |
| 0.40 to 0.60 | Limited | Model finds some positives but has a noticeable miss or false-alarm load | Compare F0.5 and F2 |
| 0.60 to 0.75 | Usable | Balanced enough for many review workflows with human oversight | Check class prevalence |
| 0.75 to 0.90 | Strong | Precision and recall are both high enough for confident ranking or triage | Validate on holdout data |
| 0.90 to 1.00 | Excellent | Very few positive-class errors at the measured threshold | Watch for leakage or duplicates |
⚖Beta Weighting Quick Table
| Score | Beta | Weighting | Use When | Example Task |
|---|---|---|---|---|
| F0.5 | 0.5 | Precision counts 4x recall | False positives are costly | Manual fraud review queue |
| F1 | 1.0 | Precision and recall balanced | Both error types matter similarly | General model comparison |
| F2 | 2.0 | Recall counts 4x precision | Misses are costly | Medical or safety triage |
| F3 | 3.0 | Recall counts 9x precision | False negatives are critical | Rare incident detection |
| Custom F-beta | Any > 0 | Beta squared sets the emphasis | Your workflow has a known tradeoff | Threshold tuning report |
🗂Preset Reference Table
| Preset | TP | FP | FN | TN | Threshold | Main Read |
|---|---|---|---|---|---|---|
| Spam inbox filter | 420 | 80 | 60 | 1440 | 0.50 | Balanced precision and recall for everyday filtering |
| Fraud review queue | 164 | 46 | 86 | 9704 | 0.72 | Precision matters because reviews are limited |
| Medical triage model | 286 | 114 | 14 | 1586 | 0.28 | Recall-heavy operating point with more false alarms |
| Factory defect vision | 92 | 18 | 28 | 3862 | 0.61 | Low-prevalence quality case where FP load matters |
| Rare event detector | 18 | 82 | 12 | 9888 | 0.35 | Accuracy looks high while F1 reveals poor precision |
| Content moderation | 740 | 260 | 160 | 2840 | 0.45 | Useful but threshold tuning can reduce review burden |
| Search relevance audit | 1280 | 220 | 320 | 2180 | 0.55 | High-volume information retrieval comparison |
| Security alert tuning | 66 | 234 | 24 | 9676 | 0.42 | Recall is strong but false alerts dominate the queue |
| Small pilot classifier | 23 | 9 | 7 | 61 | 0.50 | Small denominators need cautious reporting |
| Recall-heavy test | 470 | 430 | 30 | 2070 | 0.22 | F2 rises because recall is intentionally prioritized |
📐Full Formula Breakdown
💡F1 Reporting Tips
Educational calculation only. For production model selection, validate on held-out data and inspect per-class, micro, and macro results when more than two classes are involved.
Accuracy is the deadliest lie in data science. You train a model to spot some kind of rare fraud. It is ninety-nine percent accurate! That’s amazing. Looks like a miracle worker.
How’d they do it? They did it by assuming everything was safe. They didn’t find any fraud: they just guessed everything was okay. This means the model actualy failed its one true mission. This is where the F1 score comes from.
Why Accuracy Is Not Enough
The F1 score reveals the fake magic of perfect accuracy. It makes you see what the real tradeoff is: how many positives are we trying to find versus how many false alarm can we avoid? After plugging in your true positives, false positives, true negatives and false negatives, the calculator above do all the math for you. And no, you don’t have to learn harmonic mean formula to use it.
To use this calculator, you must first know what each of those four inputs represents in your workflow. True positives are the number of things you got right. A false positive is the number of times you flagged an innocent person for review. False negatives are the number of times you didn’t catch a threat. True negatives = The amount of quiet background noise that usually hides real signal in a dataset where one group is much larger than the other.
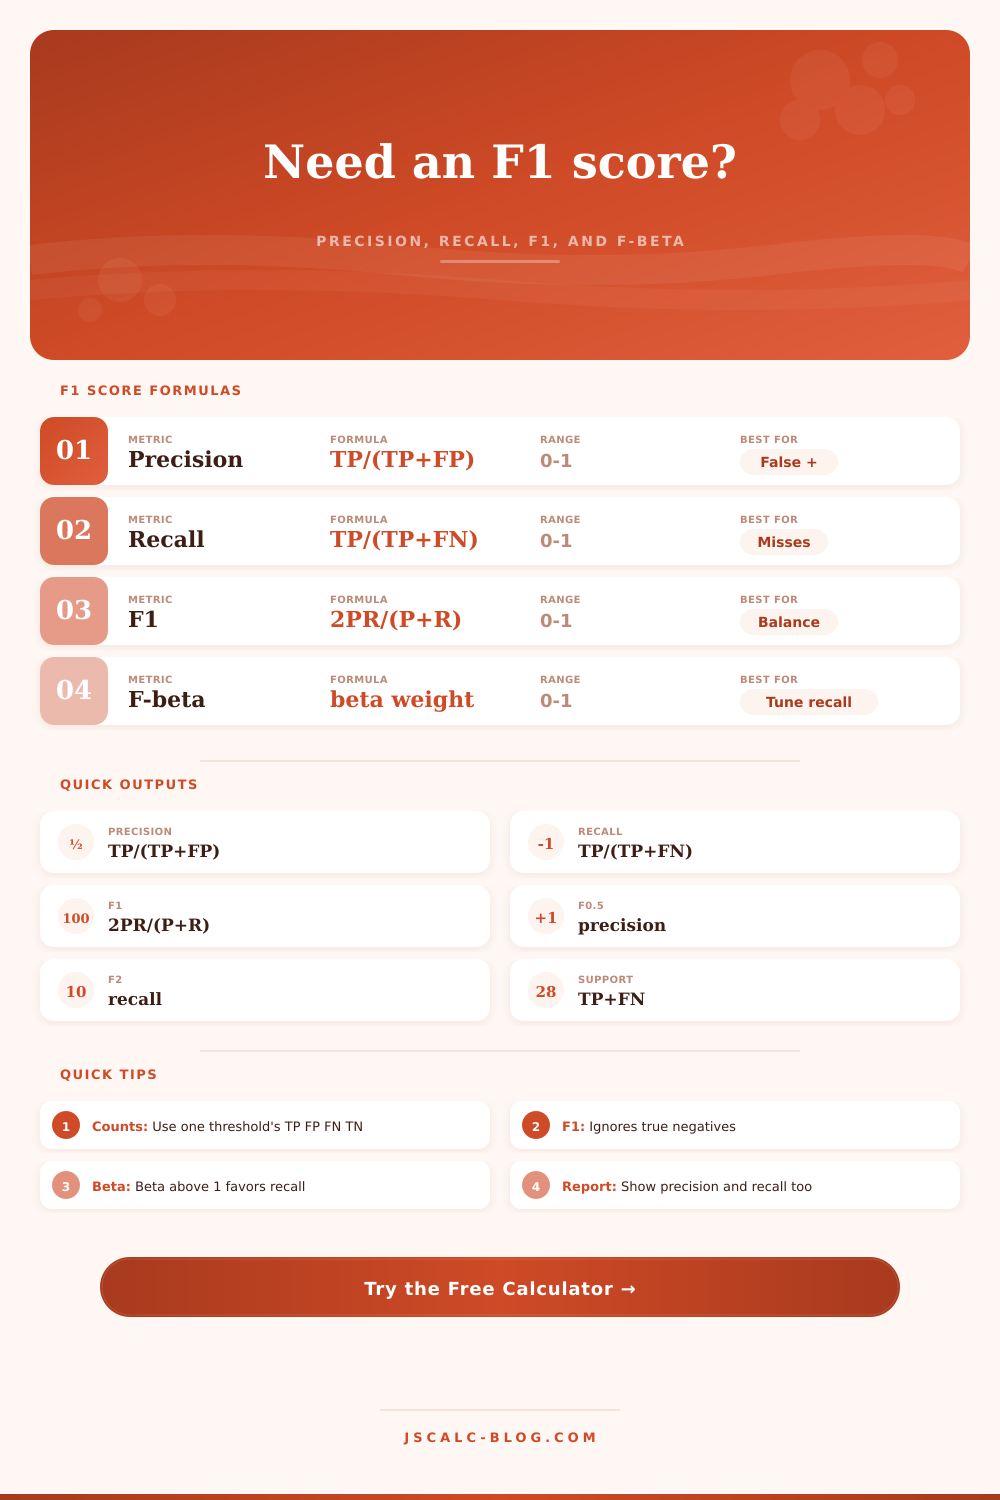
Recall is the proportion of the positive class that is correctly identified. Precision is the proportion of the predicted positives that is actually correct. The F1 score is the harmonic mean of these two metrics. It sounds academic, but what this means in practice is: if you’re good at only one, you get punished. Your F1 score will be zero if you have perfect precision but no recall. Or it could be the other way around.
You can’t game the system with a high F1 score by simply having really high precision and low recall (or vice versa). You need to be decent on both. That’s why it’s the standard metric for an imbalanced classification task where one class heavily outnumbers another.
The question is simple: how precise does your model need to be? Yes or no? False positives come at a price. Imagine having a spam filter that throws away legitimate invoices, users will be unhappy. With the calculator, you can change the beta value to give more weight to one side. Zero point five is a bet on precision. That’s math telling the model to avoid false alarms over catching all possible spam emails.
And so we come to Recall, which asks the inverse: did the model identify everything that was truly positive? Because false negatives cost something, this can matter a lot. Consider a medical screening test. It’s much worse to miss a cancer diagnosis then to run an unneeded follow-up scan. In this scenario, you’d want high recall. With the tool, you can dial the beta up to as high as two or three, which will weigh towards catching each and every case, even at the expense of generating more false alarms for your team to sift through afterwards.
The mistake most folks make is that they fixate on the number “F1”, the value itself. They think of it as a final grade. It’s not a final grade. It’s a diagnostic tool. The reference table on the page explain this. If your score is less than -0.4, generally speaking, you are probably just memorizing something useless. If it’s greater than 0.9, great job! But it is suspicious. Always double-check for possible duplicates in your sample or data leakage if the score looks too good to be true.
But that’s where precision and recall get compared side-by-side to do their work. You could have two models with identical F1 scores, but wildly different error profiles. You could have one model that never makes an incorrect call but misses half its positives. Or another model that catches all the positives, but flags half the negatives as positive. Neither is objectively superior. Your business cost dictates what you should of choose.
Do you need precision to keep from overwhelming your review team? Do you need recall to stop losing customers due to missed issues? Likewise, be wary of how often the positive class occurs. Support counts matter in rare event detection. A false negative can tank your recall rate by ten percent if it’s one of only ten positive events in your test set. Metrics is volatile on small sample sizes. That’s why the calculator displays the support number. It reminds you that the denominator is just as important as the numerator.
Aim for the outcome, not just the score. An F1 score is a compass, not a map. It’s pointing you in the right direction. But you still need to walk the path by adjusting your feature set, collection of data, or tweaking your threshold. The real world won’t always be clean but the math will be. Remember that as you read the result.