Wealth Percentile Calculator
Enter your household net worth, assets minus liabilities, to estimate your US net-worth percentile using approximate Federal Reserve Survey of Consumer Finances breakpoints. See how far you rank above other households, an age-adjusted percentile, and the gap to your next milestone.
💰How Do You Want to Enter Wealth?
🎯Real Household Presets
📝Household Wealth Inputs
Total assets minus every debt. Negative values are allowed.
Cash, investments, retirement, home value, cars, business equity.
Mortgage, student loans, car loans, credit cards, all debts.
Used for the age-adjusted percentile multiplier.
Context only; SCF breakpoints below are per household.
Symbol only; benchmarks stay on the US SCF scale.
Choose which rank drives the headline summary.
Controls rounding on the percentile figures.
🔢Percentile Formula Snapshot
📊US Net-Worth Percentile Breakpoints (Approx SCF)
| Percentile | Net Worth Threshold | Reads As | Tier |
|---|---|---|---|
| 10th | -$1,000 | Roughly break-even | Bottom 10% |
| 25th | $16,000 | Small buffer | Lower quartile |
| 40th | $96,000 | Building up | Below median |
| 50th | $190,000 | Typical household | Median |
| 60th | $280,000 | Above average | Above median |
| 75th | $660,000 | Comfortable | Upper quartile |
| 90th | $1,900,000 | Affluent | Top 10% |
| 95th | $3,800,000 | Wealthy | Top 5% |
| 99th | $16,700,000 | Very wealthy | Top 1% |
🧓Median Net Worth by Age Bracket (Approx SCF)
| Age Bracket | Median Net Worth | Age Multiplier | Interpretation |
|---|---|---|---|
| Under 35 | $39,000 | 0.42 | Early career, debts fresh |
| 35 to 44 | $135,000 | 0.72 | Growth years |
| 45 to 54 | $247,000 | 1.00 | Peak earning baseline |
| 55 to 64 | $364,000 | 1.18 | Pre-retirement peak |
| 65 to 74 | $410,000 | 1.22 | Early retirement |
| 75 and older | $335,000 | 1.10 | Drawdown phase |
🏆Wealth Milestone Thresholds
| Milestone | Percentile | Net Worth | Households Below |
|---|---|---|---|
| Positive net worth | Above 11th | $0 | About 11% |
| Six figures | About 41st | $100,000 | About 41% |
| Top half | 50th | $190,000 | 50% |
| Top quarter | 75th | $660,000 | 75% |
| Millionaire | About 82nd | $1,000,000 | About 82% |
| Top 10% | 90th | $1,900,000 | 90% |
| Top 5% | 95th | $3,800,000 | 95% |
| Top 1% | 99th | $16,700,000 | 99% |
💳Assets and Liabilities Examples
| Item | Counts As | Example | Effect on Net Worth |
|---|---|---|---|
| Checking and savings | Asset | $15,000 | Adds to net worth |
| Retirement 401k and IRA | Asset | $120,000 | Adds to net worth |
| Home market value | Asset | $350,000 | Adds to net worth |
| Vehicles resale | Asset | $25,000 | Adds to net worth |
| Mortgage balance | Liability | $240,000 | Subtracts from net worth |
| Student loans | Liability | $32,000 | Subtracts from net worth |
| Credit card debt | Liability | $6,000 | Subtracts from net worth |
🗄Percentile vs Net Worth vs Age Comparison Grid
| Percentile | All Ages | Under 35 | 45 to 54 | 65 to 74 | Tier |
|---|---|---|---|---|---|
| 25th | $16,000 | $7,000 | $16,000 | $20,000 | Lower |
| 40th | $96,000 | $40,000 | $96,000 | $117,000 | Below median |
| 50th | $190,000 | $80,000 | $190,000 | $232,000 | Median |
| 60th | $280,000 | $118,000 | $280,000 | $342,000 | Above median |
| 75th | $660,000 | $277,000 | $660,000 | $805,000 | Upper quartile |
| 90th | $1,900,000 | $798,000 | $1,900,000 | $2,318,000 | Top 10% |
| 95th | $3,800,000 | $1,596,000 | $3,800,000 | $4,636,000 | Top 5% |
| 99th | $16,700,000 | $7,014,000 | $16,700,000 | $20,374,000 | Top 1% |
⚙How the Percentile Is Computed
💡Wealth Percentile Tips
This leads us to where you sit in terms of wealth. Where do you rank? What are the next steps? That’s why this wealth percentile calculator exists.
Input your household net worth, and it will place it within the US distribution (using Federal Reserve breakpoints). It creates a map of where you sit compared to others.
What Is Your Net Worth?
What is the next milestones? The real bottom line is Net Worth. Your Net Worth are your total assets minus your total liabilities. The formula is NW = A, L.
Assets are things like value of your car; the value of your house (less your mortgage); money in the bank; and investments and retirement funds. Liabilities are all debts. These include student loan, car loans, credit cards, and mortgages.
Most folks think that their house’s value is their net worth. Their mortgage balance doesn’t matter to them. And that is where they makes mistakes. You can plug in your net worth or break down how much you have in “assets” and “debt,” to help you get an accurate picture of what you realy own.
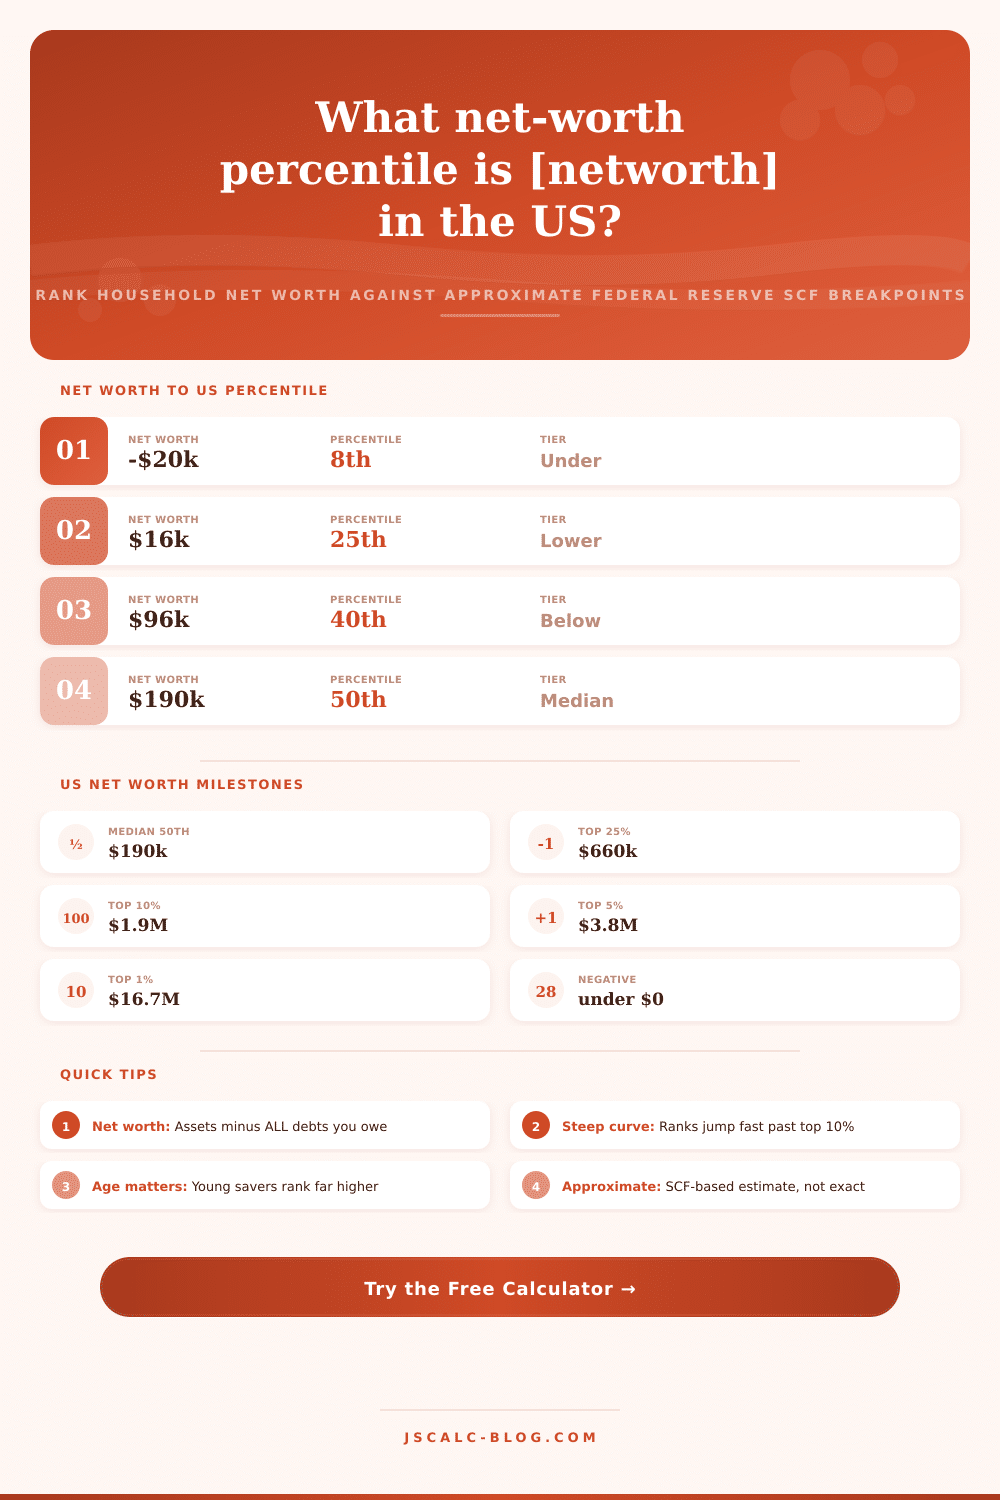
Rather than using averages, which are misleading because wealth is skewed, the calculator fills in the gaps between published percentile breakpoints. The 25th percentile is approximately $16,000. The 50th (median) are about $190,000. The 75th percentile is $660,000-ish. The top 1 percent is about $16.7 million.
If your net worth lies somewhere between two point, the calculator will slide your ranking smoothly along that line. That results in an exact estimate, not a vague range. It shows how much higher up the list your household rank compared to others.
This is the proportion of households that you out-earn. If you rank at the 70th percentile, for example, this implies that roughly 70% of U.S. Families are less wealthy then you. Families earn less than you do. This turns those vague numbers into real status. Instead of moving from 10th to 20th place, it’s a matter of leapfrogging over one-tenth of all American households.
But it gets different when you think about age. A $75k at 30 is light years ahead of average. But a $75K at 60 might lag behind. To correct for that, the calculator multiply by an age bracket multiplier. People who save earlier in life recieve credit for their youth. As we near retirement ages, older households must jump over higher bars. Their adjusted percentile reflect a more reasonable query. How do I compare against people my age?
Then things get steep. Extra savings makes a noticeable difference below the 90th percentile. Once you pass it, however, the thresholds goes crazy. Nine percentile points span from $1.9 million to $16.7 million. That’s right, those nine percentile points span a jump from $1.9 million to $16.7 million in net worth.
That’s why reaching the top tier can feel like a wall. Breaking through the first million might be the toughest hurdle. And it’s the one that matters most.
These dynamics are illustrated by the presets. Load up a grad student with debt. Load a new graduate with negative debt. Load up a retiree with $1.2 million. How do these different life stages pans out? The table of milestones marks key lines. These include when you reach a positive net worth and when you cross into the 82nd percentile (i.e., become a millionaire).
Tweak the numbers and see how your standing change if you pay off a loan. See how it changes if you raise your income. Consider these numbers as estimates. (They aren’t actualy scores.) They’re survey-based. Costs differ by region. Your personal possessions is tricky to quantify.
But here’s the thing: That percentile is a powerful reframe. It turns your own balance sheet into a national standing. Focus on that gap-to-next-decile number. Plug in your numbers, then look at your age-adjusted standing. See how much you need to move up. It’s not about comparing; it’s about clarity.