Growth Chart Percentile Calculator
Enter a child's sex, age from 2 to 20 years, and a stature, weight, or BMI-for-age measurement. Using the CDC LMS method the tool computes a z-score, converts it to a percentile with the normal distribution, names the nearest standard percentile curve, and gives an interpretation band. Reference LMS values are approximate CDC points for education only.
📏Choose a Measurement
🧒Real Child Growth Presets
📝Child Measurement Inputs
CDC growth references differ by sex.
Decimals allowed, e.g. 5.5 for 5 years 6 months.
Match this to the value you are entering.
Height, weight, or BMI number.
BMI is always kg per square meter and ignores this toggle.
Choose a curve to see the value it represents at this age.
Controls the displayed percentile precision.
Optional. In BMI mode, enter height here (same units) to auto-fill BMI from weight.
For educational purposes only. These are approximate CDC LMS reference points, not a clinical growth chart. Always consult a pediatrician for medical interpretation of a child's growth.
🔢LMS and Z-Score Snapshot
📈Standard Percentile Curves and Z-Scores
| Percentile Curve | Z-Score | Position | Reads As |
|---|---|---|---|
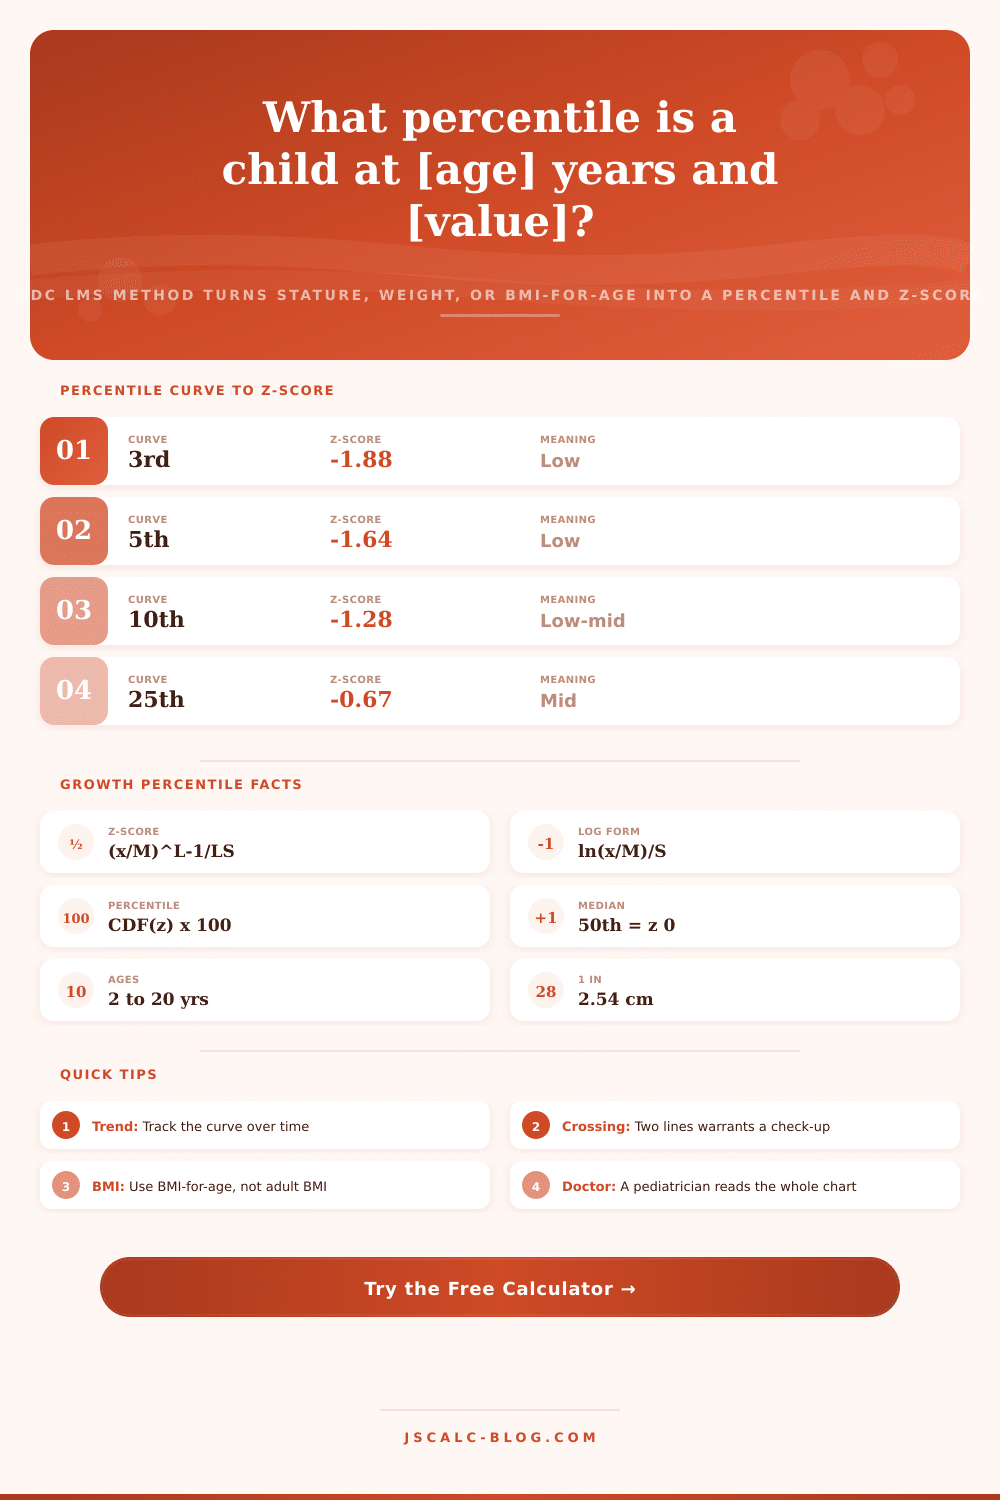
| 3rd | -1.88 | Lower tail | 3 in 100 below |
| 5th | -1.64 | Lower tail | 5 in 100 below |
| 10th | -1.28 | Below middle | 10 in 100 below |
| 25th | -0.67 | Lower middle | Quartile 1 |
| 50th | 0.00 | Center | The median |
| 75th | 0.67 | Upper middle | Quartile 3 |
| 90th | 1.28 | Above middle | 90 in 100 below |
| 95th | 1.64 | Upper tail | 95 in 100 below |
| 97th | 1.88 | Upper tail | 97 in 100 below |
📋Representative CDC LMS Points by Age
| Measure and Sex | Age | L | M (median) | S |
|---|---|---|---|---|
| Stature boy | 2 yr | 1.00 | 86.5 cm | 0.040 |
| Stature boy | 10 yr | 1.00 | 138.5 cm | 0.045 |
| Stature girl | 10 yr | 1.00 | 138.6 cm | 0.047 |
| Weight boy | 5 yr | -0.35 | 18.5 kg | 0.120 |
| Weight boy | 10 yr | -1.20 | 31.4 kg | 0.165 |
| Weight girl | 10 yr | -0.95 | 32.0 kg | 0.170 |
| BMI boy | 10 yr | -2.20 | 16.6 | 0.120 |
| BMI girl | 15 yr | -1.75 | 20.2 | 0.140 |
⚖BMI-for-Age Weight Categories
| BMI Percentile | Weight Category | Z-Score Range | General Note |
|---|---|---|---|
| Below 5th | Underweight | Below -1.64 | May need review |
| 5th to 84th | Healthy weight | -1.64 to 1.00 | Typical range |
| 85th to 94th | Overweight | 1.04 to 1.55 | Watch the trend |
| 95th and above | Obesity | 1.64 and up | Discuss with doctor |
| 120% of 95th | Severe obesity | Well above 1.64 | Clinical follow-up |
📏Unit Conversions for Growth Data
| Unit | Equals | Reverse | Use |
|---|---|---|---|
| 1 inch | 2.54 cm | 1 cm = 0.3937 in | Stature |
| 1 foot | 30.48 cm | 1 cm = 0.0328 ft | Height |
| 1 pound | 0.4536 kg | 1 kg = 2.2046 lb | Weight |
| 1 stone | 6.35 kg | 1 kg = 0.1575 st | Weight |
| BMI | kg / m squared | 703 x lb / in^2 | BMI-for-age |
| 1 year | 12 months | 1 mo = 0.0833 yr | Age |
🗃Median (50th) Stature and Weight by Age
| Age | Boy Stature | Girl Stature | Boy Weight | Girl Weight | Boy BMI |
|---|---|---|---|---|---|
| 2 yr | 86.5 cm | 85.0 cm | 12.6 kg | 12.0 kg | 16.4 |
| 4 yr | 102.5 cm | 101.5 cm | 16.3 kg | 15.9 kg | 15.7 |
| 6 yr | 115.5 cm | 114.5 cm | 20.5 kg | 19.9 kg | 15.5 |
| 8 yr | 127.5 cm | 127.0 cm | 25.4 kg | 25.3 kg | 15.9 |
| 10 yr | 138.5 cm | 138.6 cm | 31.4 kg | 32.0 kg | 16.6 |
| 12 yr | 149.0 cm | 151.5 cm | 39.9 kg | 41.5 kg | 17.8 |
| 14 yr | 163.5 cm | 159.5 cm | 50.8 kg | 49.4 kg | 19.4 |
| 16 yr | 172.5 cm | 162.5 cm | 61.0 kg | 54.0 kg | 20.5 |
| 18 yr | 176.0 cm | 163.0 cm | 67.0 kg | 56.6 kg | 21.6 |
| 20 yr | 177.0 cm | 163.2 cm | 70.4 kg | 57.9 kg | 22.5 |
⚙Formula Breakdown
💡Growth Tracking Tips
For example, the growth chart percentile calculator takes your child’s measurements of height, weight, or body mass index at any time from age two until 20, together with their gender, and produces a percentile for that data point, just like they does in your pediatrician’s office. It does this by using the CDC’s LMS method to calculate a z-score from your measurement and then translating it back into a percentile based on standard normal distribution. You do not need to interpret messy printed lines. Instead, you gets a specific number, the closest percentile line, and the interpretation band.
A percentile describes where a child stand compared to a large group of other children of same sex and age. For example, if a boy has a height at the 60th percentile, this implies that about sixty out of every one hundred other boys his age would be shorter then he is, while forty would be taller. Note that middle point (the 50th percentile) is also called median.
How the Growth Calculator Works
Because a child at either the 15th or 85th percentile could be perfectly healthy, percentiles are not measures of health. Instead, what matter most is how a child’s growth relates to their own past growth and whether it tracks along consistent curve over time.
The trouble is that kids is measured differently in different ways and their weights aren’t always perfectly symmetric around their mean, the BMI has a long right-hand tail. In such situations, a simple mean and standard deviation will misplace many child. The CDC’s solution here are called the LMS method. This method describes each (age, sex) combination using three numbers: M, the median; L, the power that transforms data to remove skew; and S, coefficient of variation.
The three numbers specify entire distribution at each age and thereby allow them to nail down any percentiles without needing to list out all curves individually. It’s pretty complex math and fortunately the calculator does it for you instead of requiring you to work through equations yourself. In other words, the child’s placement on the chart takes into account the standard deviation (S) as well as the mean (M). The z-score formula look like this: ((value/M)^L, 1) / (L*S), where L isn’t always zero.
For most stature curves, however, when L is approaching zero it becomes a log limit. After removing any skew, the z-score indicate where the child falls in terms of standard deviations away from median. The median is a z-score of 0, the 90th percentile is about 1.28, and the 3rd percentile is about -1.88. From there, after you know your z-score, the percentile is simply area beneath the standard normal curve to the left of this score. The result panel reports certain curves (such as the 3rd, 10th, 50th, 90th and 97th) along with their expected z-scores.
All calculations are summarized in four cards for clarity. The percentile card contains the headline number, and the z-score card displays standardized distance from median. The interpretation band card turns the percentile into clinically useful categories. The nearest curve card identify the closest standard line.
For older kids aged two through twenty, there are three measurements in addition to the infant chart ranges for birth to thirty-six months of age. By clicking one button, you swap between BMI-for-age, stature-for-age and weight-for-age. The calculator has a built-in unit toggle to accept either metric (kilograms, centimeters) or U.S. Units (pounds, inches). It uses pounds and inches to convert internally.
There’s also an option in BMI mode where the calculator will derives the BMI from the entered weight automaticly if you enter the height as well. To make starting to use the tool easier, there are ten realistic presets that fill out the fields immediately; this way you can check out how the tool works without having to enter your own numbers first.
Normally, kids move in a predictable way along smooth curve. You want to see the trend, not any particular point. However, if they cross two big percentile lines upward or downward at some visit, it would of been worth discussing with pediatrician. That is what show the true picture over time.
For those wondering, the embedded LMS values aren’t entire official tables. They are just some sample points that gives you an idea of what would be expected when using this kind of tool. No online tool is ever a replacement for having a clinician read the entire chart while considering the kid’s history. Input your own figures, pick one of the presets, then take the output as a reasonably informed place to start.