Wave Energy Converter Types
Compare wave energy converter technologies. Estimate deep-water wave power, then apply a device-type capture efficiency for point absorber, oscillating water column, attenuator, and overtopping WECs to get captured power and annual energy.
🌊Real Device & Sea-State Presets
📝Wave & Device Inputs
Selecting a type loads its typical capture efficiency.
Average height of the highest one third of waves.
Spectral energy period; near 0.9 of the peak period.
Width of wave front the device intercepts.
Share of raw wave power the device converts.
Average yearly output vs. rated capture power.
Seawater 1025, fresh water about 1000.
Total captured power and energy scale by count.
🔢Formula Snapshot
⚙WEC Device Types & Efficiency
| Device Type | Capture Efficiency | Typical Width | Example |
|---|---|---|---|
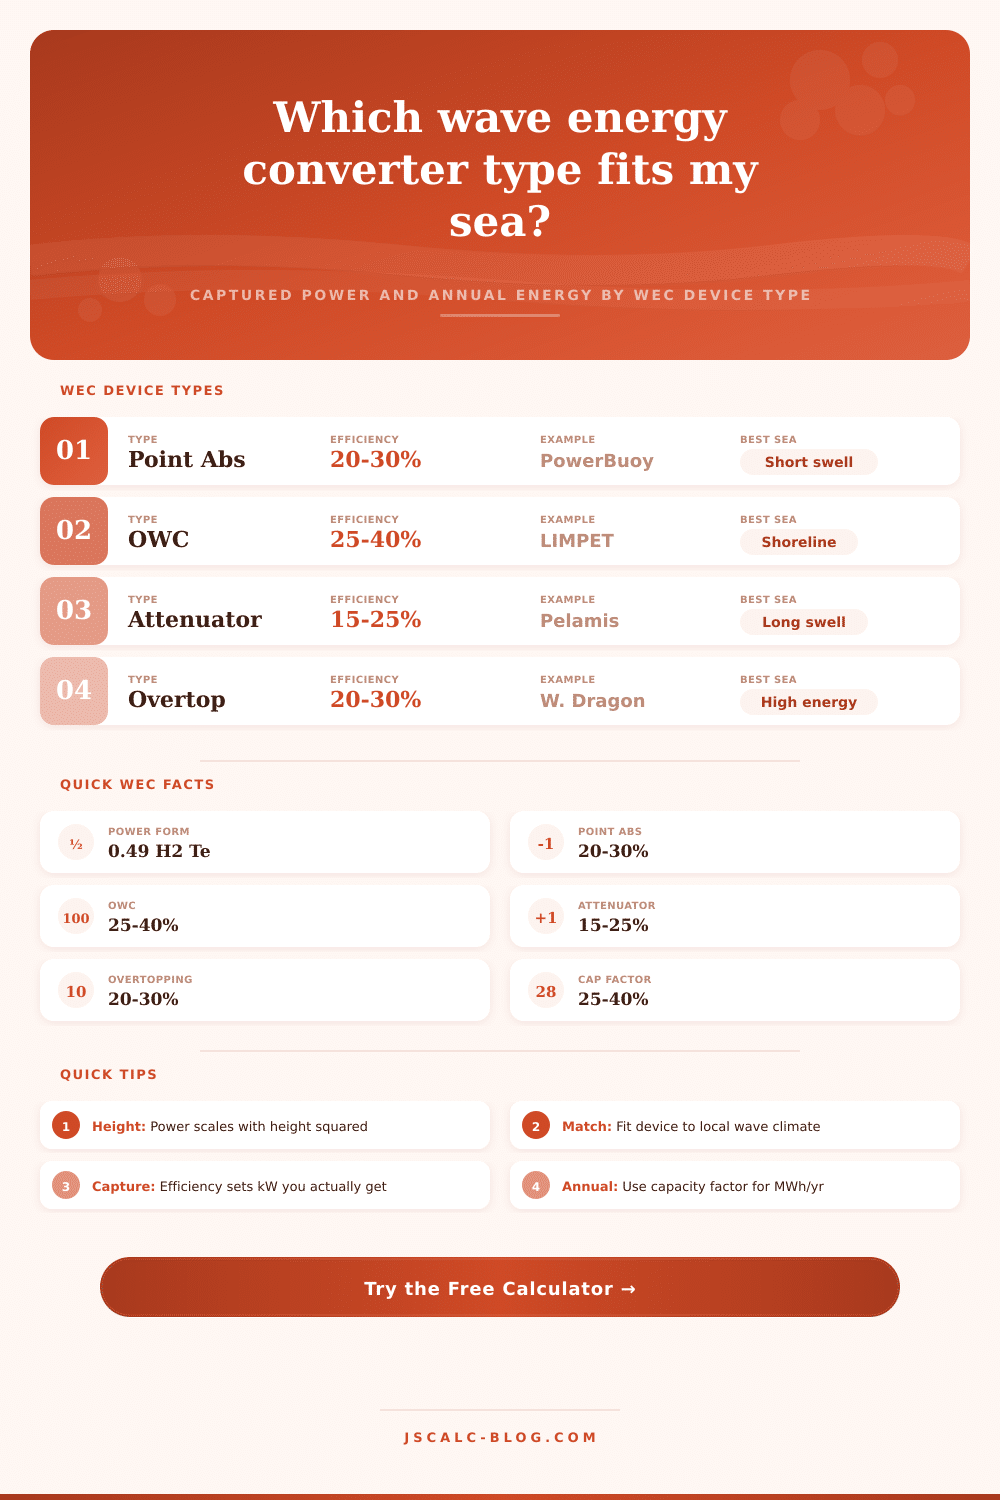
| Point absorber | 20 to 30% | 3 to 12 m | PowerBuoy, CorPower |
| Oscillating water column | 25 to 40% | 4 to 20 m | LIMPET, Mutriku |
| Attenuator | 15 to 25% | 120 to 180 m | Pelamis P2 |
| Overtopping | 20 to 30% | 150 to 300 m | Wave Dragon |
| Oscillating surge flap | 25 to 35% | 18 to 26 m | Oyster 800 |
📊Wave Power by Height & Period
| Hs × Te | Te = 6 s | Te = 8 s | Te = 10 s | Te = 12 s | Te = 14 s |
|---|---|---|---|---|---|
| Hs = 0.5 m | 0.74 kW/m | 0.98 kW/m | 1.23 kW/m | 1.47 kW/m | 1.72 kW/m |
| Hs = 1.0 m | 2.94 kW/m | 3.92 kW/m | 4.90 kW/m | 5.88 kW/m | 6.86 kW/m |
| Hs = 2.0 m | 11.8 kW/m | 15.7 kW/m | 19.6 kW/m | 23.5 kW/m | 27.4 kW/m |
| Hs = 3.0 m | 26.5 kW/m | 35.3 kW/m | 44.1 kW/m | 52.9 kW/m | 61.7 kW/m |
| Hs = 5.0 m | 73.5 kW/m | 98.0 kW/m | 123 kW/m | 147 kW/m | 172 kW/m |
🌎Sea-State Wave Climate
| Wave Climate | Hs Range | Typical Te | Resource |
|---|---|---|---|
| Sheltered / mild | 0.5 to 1.0 m | 4 to 6 s | 1 to 5 kW/m |
| Moderate coast | 1.5 to 2.5 m | 7 to 9 s | 10 to 30 kW/m |
| Energetic swell | 2.5 to 3.5 m | 9 to 11 s | 30 to 65 kW/m |
| North Atlantic west | 3.0 to 4.0 m | 10 to 12 s | 40 to 90 kW/m |
| Storm / extreme | 5.0 to 8.0 m | 12 to 16 s | 150 to 450 kW/m |
🗂WEC Technology Comparison Grid
| Device Type | Operating Principle | Efficiency | Capture Basis | Best Sea State | Example Device |
|---|---|---|---|---|---|
| Point absorber | Buoy heaves with surface, drives PTO | 20 to 30% | Small width, resonant | Short to medium swell | PowerBuoy |
| Oscillating water column | Air chamber drives a Wells turbine | 25 to 40% | Chamber mouth width | Shoreline, breakwater | LIMPET, Mutriku |
| Attenuator | Long float flexes at joints along wave | 15 to 25% | Aligned to wave travel | Long-period ocean swell | Pelamis P2 |
| Overtopping | Waves spill over ramp into reservoir | 20 to 30% | Wide ramp crest length | High-energy offshore | Wave Dragon |
| Oscillating surge flap | Flap pivots with near-shore surge | 25 to 35% | Flap width nearshore | Shallow surge zone | Oyster 800 |
| Submerged pressure | Seabed buoy flexes under pressure | 15 to 25% | Submerged footprint | Nearshore, sheltered | CETO |
📈Capacity Factor Reference
| Site & Tuning | Capacity Factor | Full-Load Hours | Note |
|---|---|---|---|
| Low resource, poor match | 15 to 20% | 1300 to 1750 h | Undersized resource |
| Moderate, average tuning | 25 to 30% | 2200 to 2600 h | Typical demo site |
| Energetic, well matched | 30 to 40% | 2600 to 3500 h | Good swell climate |
| Premium Atlantic site | 35 to 45% | 3100 to 3900 h | Consistent long swell |
📐Full Formula Breakdown
📋Captured Power by Device Type
Example sea Hs = 2 m, Te = 8 s (15.7 kW/m). Front power = 15.7 × device width.
| Device Type | Width Used | Efficiency | Captured Power |
|---|---|---|---|
| Point absorber | 8 m | 25% | 31.4 kW |
| Oscillating water column | 12 m | 32% | 60.3 kW |
| Attenuator | 150 m | 20% | 471 kW |
| Overtopping | 180 m | 25% | 707 kW |
| Oscillating surge flap | 26 m | 30% | 123 kW |
💡Practical WEC Type Tips
Using the power of the ocean has always been hard; its rawness is something that we’ve long treated as easy to ignore. But it’s not: The power are delivered as steady rhythmic swells powered by global systems, not gusty bursts dependent upon momentary conditions.
To make this work, picking the correct device is hugely important: No one size fits all. If you have a great site, you can afford to choose poorly. If you have a mediocre site, you must choose wisely too succeed. It’s the difference between a viable project and one that costs more then much.
Choosing the Right Wave Energy Device for Your Site
People tend to seriously fixate on the single number: How big are the waves? Not so fast. To begin, that’s not really what either one mean. Once you plug your local conditions into calculator above (it runs the math for you), read on to understand why we ask for two values, not just one.
While significant wave height is a key factor in calculating power in deep water, it’s a mistake to look at height alone because period matter too. The amount of power grows with square of the significant wave height. This means when you double the height, you quadruple the power.
Now the period matters. A longer period means more mass and momentum is carried. So the same three-meter swell with a ten second period has a lot more energy than a three-meter “chop” with a six-second period. Take a look at the power-per-meter jump in reference table on the page. You will see how the numbers change as the period rises and the height remain flat.
Next is matching the resource to a machine. A point absorber is basically just a buoy bobbing up and down on ocean’s surface while driving a power take off system below the surface. The device resonates with incoming wave energy which works best in areas of moderate swell. Efficiency is decent but not spectacular.
An oscillating water column use the change in air pressure as waves enter an enclosed chamber spinning a turbine. These devices are often built as part of a shoreline or breakwater structure. They perform better in short-period, more irregular seas compared to their offshore versions. Here is the trade off between location and resource intensity.
Floats: Long structures oriented parallel to the waves, they attenuate energy as it passes along their length. As wave travels its length it flexes at its joints. They are best suited for long-period swell. An attenuator isn’t going to produce much if your sea state is disorganized (i.e., a chop). Attenuators have long footprints, too.
Overtopping devices use a ramp to direct waves into a reservoir above sea level. Water flow back downward through conventional turbines. The beauty of this approach is that it’s like a hydroelectric dam, just using the ocean; however, it needs wide footprints and high-energy sites.
To determine annual energy produced, the calculator multiplies amount of energy you’ve captured with a number called a capacity factor. Essentialsly that’s how long it runs a year at rated power. Of course wave farms don’t operate at full tilt all the time. They’ll be turned off during storms, or they will vary with the seas. They require maintenance. A good capacity factor provides more realistic view of what you can expect economically.
In other words, you may capture fifty kilowatts in a big storm, but maybe on average ten through the year. That makes a world of difference if you should of accounted for capital investment in marine infrastructure.
The toughest part of all is site selection. Energy must be available consistently, not just during extreme events. Depending on where you stand, the ocean have different characters. Short chaotic waves along a coastal shelf with shallow water are well suited for shoreline devices. Longer organized swells out in open ocean is better suited for bigger devices offshore. Chasing the best possible efficiency is less important than matching wave climate at your particular site and the type of device you have. A 30 percent efficient device poorly sited will lose every time to a 20 percent efficient device well-situated.
The marine environment is harsh and unforgiving. It eats into profit margins through corrosion, biofouling, and storm damage. In practice simplicity often prevails. Things with fewer moving parts tend to last longer and cost lesser to maintain. After decades of prototypes the technology are still maturing. From proving the concept to proving the economics we’ve moved on. Each new generation of converter strives to balance grid connection costs, structural integrity and capture area.
You need local data and you need patience to pick the right wave energy pathway. Averages aren’t enough. Seek extremes and look at seasonal variation. The calculator is a good starting point for comparing different devices, but real world performance vary depending on how well they are installed and later maintained.
Begin with the fundamentals: Period and Height. Find the type of device that excels within that tempo. Next, see if the yearly production justifies initial spend. It’s little. But it counts. The ocean won’t bend to your spreadsheet; you must adjust to its terms.