Payload Fraction Calculator
Compare payload mass, liftoff mass, structural mass, propellant mass, payload-to-dry ratio, and mission margin against practical launch benchmarks.
🚀Real Vehicle Presets
⚙Mass Inputs
Payload Fraction Results
📊Comparison Grid
📐Formula Breakdown
| Metric | Formula | What It Compares | Use In This Calculator |
|---|---|---|---|
| Payload fraction | payload mass / liftoff mass | Delivered useful mass versus total starting mass | Main efficiency result and mission target comparison |
| Structural fraction | dry structural mass / liftoff mass | Inert vehicle mass versus total starting mass | Shows how much liftoff mass is not propellant or payload |
| Propellant fraction | propellant mass / liftoff mass | Usable propellant versus total starting mass | Checks whether the vehicle is massed like a launch system |
| Payload-to-dry mass | payload mass / dry structural mass | Payload delivered for each unit of dry vehicle mass | Compares vehicle packaging against benchmark dry ratios |
| Mission margin | payload fraction - target - reserve | Payload percentage points above or below a mission class | Positive means the entered masses exceed the selected target |
🗺Mission Benchmark Table
| Mission Class | Typical Payload Fraction | Typical Structural Fraction | Typical Propellant Fraction | Payload-to-Dry Target |
|---|---|---|---|---|
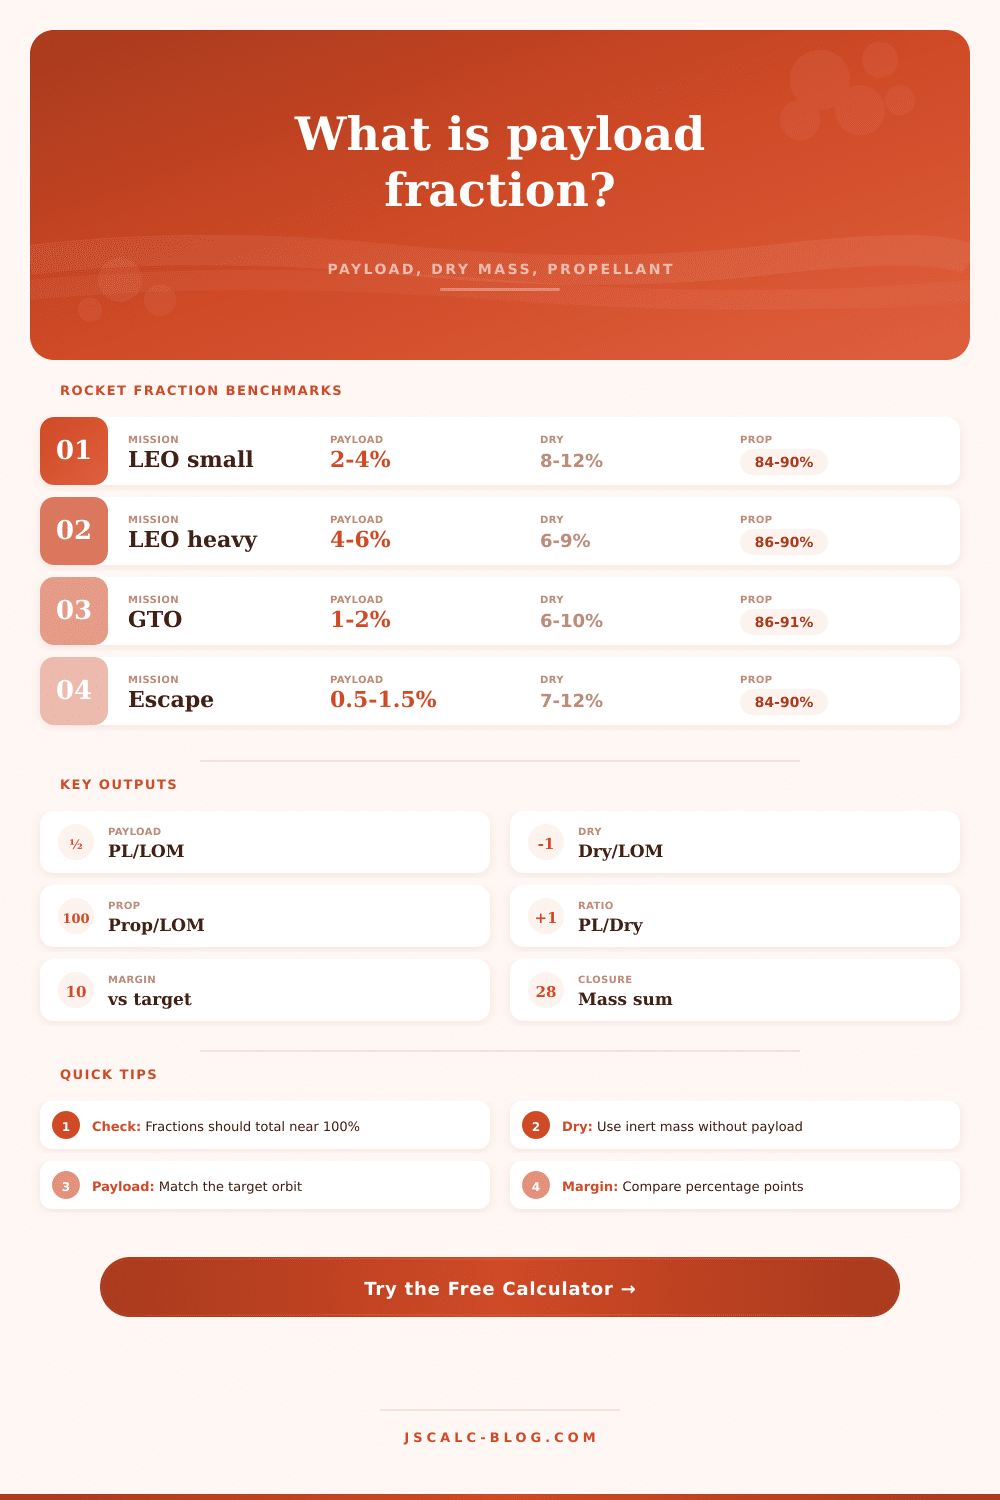
| Small launcher to LEO | 2.0% to 4.0% | 8.0% to 12.0% | 84.0% to 90.0% | 0.25 to 0.45 |
| Medium launcher to LEO | 3.0% to 5.0% | 7.0% to 10.0% | 86.0% to 90.0% | 0.40 to 0.65 |
| Heavy lift to LEO | 4.0% to 6.0% | 6.0% to 9.0% | 86.0% to 90.5% | 0.55 to 0.85 |
| Reusable booster to LEO | 2.5% to 4.0% | 8.0% to 13.0% | 83.0% to 89.0% | 0.30 to 0.55 |
| Geostationary transfer orbit | 1.0% to 2.0% | 6.0% to 10.0% | 86.0% to 91.0% | 0.15 to 0.35 |
| Polar / sun-synchronous | 1.5% to 3.0% | 8.0% to 12.0% | 84.0% to 90.0% | 0.18 to 0.40 |
| Lunar injection stack | 3.0% to 5.0% | 6.0% to 10.0% | 86.0% to 91.0% | 0.45 to 0.75 |
| Earth escape / deep space | 0.5% to 1.5% | 7.0% to 12.0% | 84.0% to 90.0% | 0.08 to 0.25 |
🛰Preset Mass Reference
| Preset | Mission | Liftoff Mass | Payload Mass | Dry / Structural Mass | Propellant Mass |
|---|---|---|---|---|---|
| Electron | LEO small satellite | 12,550 kg | 300 kg | 1,150 kg | 11,100 kg |
| Falcon 9 expendable | LEO maximum payload | 549,054 kg | 22,800 kg | 29,500 kg | 488,370 kg |
| Falcon 9 reusable | LEO with recovery allowance | 549,054 kg | 15,700 kg | 29,500 kg | 488,370 kg |
| Falcon Heavy | Heavy lift LEO | 1,420,788 kg | 63,800 kg | 82,800 kg | 1,268,150 kg |
| Ariane 5 ECA | Dual payload GTO | 777,000 kg | 10,500 kg | 53,000 kg | 700,000 kg |
| Atlas V 551 | High-energy GTO | 587,000 kg | 8,900 kg | 35,500 kg | 527,000 kg |
| Delta IV Heavy | Heavy lift LEO | 733,000 kg | 28,790 kg | 50,000 kg | 642,000 kg |
| Saturn V | Apollo LEO stack | 2,800,000 kg | 140,000 kg | 195,000 kg | 2,465,000 kg |
| Long March 5 | Heavy GTO | 867,000 kg | 14,000 kg | 60,000 kg | 777,000 kg |
| LVM3 | GTO communication satellite | 640,000 kg | 4,000 kg | 55,000 kg | 575,000 kg |
📈Fraction Interpretation Table
| Payload Fraction | Typical Reading | Likely Mission Context | What To Check |
|---|---|---|---|
| Below 1.0% | Very low delivered share | Escape, high-energy, or conservative estimate | Confirm target orbit and upper-stage mass |
| 1.0% to 2.5% | Low but common for hard missions | GTO, polar, or reusable missions | Compare against the selected mission benchmark |
| 2.5% to 4.5% | Normal launch-vehicle range | LEO small, medium, or reusable launch | Check mass closure before judging margin |
| 4.5% to 6.5% | High payload efficiency | Heavy lift or expendable LEO configuration | Ensure payload definition includes the same orbit |
| Above 6.5% | Exceptional or mismatched inputs | May include upper stage as payload or omit mass | Review liftoff, dry, propellant, and payload definitions |
🧮Common Mass Closure Checks
| Check | Formula | Preferred Range | Meaning |
|---|---|---|---|
| Accounted mass | (payload + dry + propellant + other) / liftoff | 98% to 102% | Inputs are internally consistent for a first-order estimate |
| Unassigned mass | liftoff - payload - dry - propellant - other | Near zero | Positive means unused mass remains; negative means overcounting |
| Payload-to-dry | payload / dry structural mass | 0.1 to 0.9 | Higher values indicate more payload per unit of inert mass |
| Propellant share | propellant / liftoff | 84% to 91% | Launch systems are normally dominated by propellant mass |
| Mission margin | payload fraction - benchmark - reserve | Positive | Positive means the entry beats the selected benchmark after reserve |
💡Payload Fraction Tips
When rockets sits on launchpad, they’re huge in terms of total mass. They have engines, tanks, fuel, and more. When you put them up, that’s the whole mass being used to get your payload (like a satellite). Up to orbit. That fraction is called the payload fraction. It’s the measure of how much of what you launched will make it to where it needs to go.
Everything else is paying the cost of defeating gravity. Structural material and fuel are what you pay for to achieve this. And if you understand this fraction, then you’ll realize why spaceflight costs so much money. You will also see why every kilo of structure count.
Why Rocket Weight Matters
The calculator converts masses into performance check values like payload mass, structural mass, propellant mass, mission margin, and dry-mass ratio. The payload fraction is a measure of how efficient your rocket is, removing the complication of orbital mechanics and simply showing you a nice percentage. If your fraction is low, it’s telling you something, either that you’re using too much fuel or that your vehicle are very heavy. A large fraction tells you the machine is running lean.
This fraction is much more useful then knowing the number of engines or the thrust rating, as it serves as true scorecard of design. Next let’s look at the structural fraction. This is dry mass of the rocket over its liftoff mass. It includes the airframe, engines, tanks, and avionics. You want this value to be as small as possible. A heavier structure mean less space available for payload/fuel.
Each piece of the rocket has a goal to minimize its weight. Carbon fiber composites and aluminum-lithium alloys helps them do that. Additive manufacturing also helps remove dead weight. As seen in the reference table, each class of missions balance the mass differently. Thicker structures is possible on heavy lift due to advantage of scale. Small launchers need to be light enough to carry their own fuel.
Typically the largest part of the total mass is the fraction known as the propellant. For an upper stage it is commonly over ninety percent. That’s what you’re carrying around; that’s your energy. If you add too much fuel, the structure gets heavier to hold it, and so you can fly further. There’s only so far you can do that though. Eventually all that fuel makes the structure heavier in order to support it.
This means you need even more fuel to get extra structure up into orbit. That’s where the payload-to-dry mass ratio comes in. It pits the payload against just the inert mass of the vehicle. High ratio, good. Low ratio, not so good. You’ve got too much dead weight hanging off your vehicle.
These figures also change based off the mission. For example, if you’re sending something to low Earth orbit from a small launcher then the payload fraction can be as little as three percent. Three percent may sound small but it’s actualy good for that class. Six percent may be for a heavy lifter. But because it has to bring fuel back down to land then that’ll reduce your number substantialy.
Depending on the mission type you shouldn’t just plug them into each other and go from there. You should pick a benchmark, which normalizes your comparison. Then it subtracts out your reserve margin, how much leeway do you have? Is it positive or negative? Positive means you’ve got room to spare; negative means you’re cutting it too fine.
The math must add up right The sum of the payload plus dry mass plus propellant plus everything else at launch is total liftoff mass. That’s what the math is supposed to add up to. Fractions mean nothing if it doesn’t add up properly. Did you forget about adapter rings or fairing mass? Those little guys adds up fast.
The calculator catches those for you, and raises a red flag when things don’t add up to make sure your design didn’t break conservation of mass. In the real world of engineering there are always tradeoffs. If you make the tank thin, it will burst under pressure. Making it thicker makes the vehicle too heavy. Want more fuel for better performance? It is too heavy for the launch pad.
These are all examples of trade-offs that must be considered because of the payload fraction. It quantifies those decisions with a number. Good designers do not optimize only one thing. They balance entire system. They know that perhaps a slightly reduced payload fraction might of been worthwhile for increased reusability/reliability.
Spaceflight is a battle against ratios. Each rocket mission is a compromise between your payload desires and the need to mass to send it upward. Your rocket’s design is winning when the numbers work. It is losing when they do not. Understanding the balance between propellant, structure, and payload changes how you look at rockets. No longer do you just see a collection of cylinders. Instead, you see a finely tuned set of equations. Always lift the most while lifting the least.